The Volleyball Player’s Food Table – Redefining Sports Nutrition

Sports nutritionists advocate that volleyball players at all-day tournaments graze on foods containing protein and carbohydrates. As well, the athletes are reminded to stay hydrated, i.e. drink plenty of water, stay off their feet, and rest if possible.

A player’s diet before and on the day of a tournament may determine their success on the court. With that in mind, club directors and parents came up with the player’s food table to as a means of providing nourishment for their daughters on game day.

Somewhere along the way, the focus of the food table was shifted from the players to the father’s beer bellies, the mother’s muffin tops, and the sibling’s sweet tooth. Parents used their daughter’s volleyball tournament as an opportunity to display their culinary skills with their favorite recipes for chili, fried chicken, and death-by-sugar cupcakes.

Too often the community food tables look like the picture on the right. This photo was snapped at a tournament where the host facility did not allow food inside the gymnasium, hence all food tables were located outside the front entrance to the building.

food table
A typical volleyball food table – cupcakes, chips and other goodies that do not enhance performance.

The menu for this tournament is provided below:

  • In the background is a cooler with bottled Gatorade on top. The sliced turkey, beef, and bologna are stored inside. The bread and condiments for the sandwiches are located on the table – a reasonable start.
  • On the table there is also mayonnaise and potato salad. It is best to store both inside the ice chest, especially when tables are outdoors on a warm day.
  • And the best part of the menu is the bag of Jolly Rancher candy (500 pieces), muffins, and 3 dozen cupcakes. These are an important part of a diet that provides the fans and players with an afternoon sugar rush and crash.
  • Underneath the table is a wide selection of chips – Yummy, but not what the athletes need.
  • And in the foreground is the unopened bag of apples and oranges on top of the cooler. Because the bag of fruit was never opened, it was presumably placed on the ice chest to keep the lid from blowing away and as a deterrent for those wanting to get a soda or other sugar-based drink.

And parents wonder why their daughters are playing in the lower divisions.


Meaningful Touches in a Volleyball Practice Matter!

Meaningful touches make a difference in the rate at which players and teams improve.

The number of touches may be determined by the time spent on non-volleyball activities (setup, warm-up, discussions, dealing with injured players, cool-downs). As well, teams may spend time in strategy talks, working on mental toughness, or reviewing videos of match play. All of these activities can play an important role in the learning process even if no meaningful touches are associated with them.

In addition, the number of touches may vary as a result of the skill level of the athletes, number of courts, equipment and training aids, amount of practice time, coaching philosophy, and the drills selected.

While the number of touches matters, coaches should optimize, rather than maximize, the number of touches based on the needs of the team.

Consider the following two scenarios:

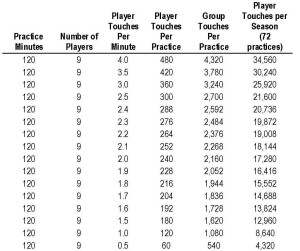
  1. A player on a team that averages 1.0 meaningful touch every minute, or 120 touches every practice. This player will get 8,640 touches during the season.
  2. On the other hand a player that averages 2.0 meaningful touches every minute, or 240 touches every practice, will get 17,280 touches during the season.

Both scenarios are highlighted in the table below.

Meaningful touches make a difference in the rate at which players and teams improve.

The difference between these two scenarios is 8,640 touches over the course of the season.

17,280 touches (scenario 2) minus 8,640 touches (scenario 1) = 8,640 touches.

That number of touches is equivalent to 36 practice sessions. In other words, the team with 2.0 meaningful player touches per minute is theoretically half a season ahead of the team that gets 1.0 meaningful player touches per minute by the end of the season.

Meaningful touches matter! It is essential for coaches to optimize the number of touches in their practices.


NCAA Volleyball Quarterfinalists Represent 24 States and 5 Countries

The Big 12 and the PAC 12 conferences dominated the NCAA Women’s Volleyball Championships. Teams from their conferences filled 7 of the 8 quarterfinal slots. Texas was the only school from another conference.

This brief analysis identifies the home states of the most active players from the teams in the quarterfinals. Information was gathered from the rosters and stats pages of the school’s athletic department websites. Only players were included in this analysis that played more than half the sets during the season.

 Team  Number of Players Playing Playing More Than Half of the Sets in 2013  Number of Players Playing Sets in 2013 Season
Nebraska  9 15
Penn State  10 18
Purdue  11 13
Stanford  8 15
Texas 10 13
USC 11 15
Washington  9 12
Wisconsin  9 13
  Total  77  114


The following two tables identify the home countries and states for the quarterfinalists. The first table looks at the location by country and the second table identifies the home state for the U.S. players.

There were only 5 foreign players at four schools. Four of the quarterfinalists had all players from the U.S.

NU

PSU

Purdue

Stanford

Texas

USC

U of W

Wisconsin

Total

Italy

1

1

Mexico

1

1

PuertoRico

1

1

2

Sweden

1

1

U.S.

8

9

11

8

10

9

8

9

72

 Total

9

10

11

8

10

11

9

9

77


The rosters of most teams included players from within their regions. For example Purdue has 6 players from Indiana and USC had five players from California.

Of the 72 players from the U.S., 15 were from California, 11 from Texas, 9 from Illinois and 7 from Indiana.

Five of the 8 schools have players from California, 6 schools have players from Texas, and 4 schools have players from Illinois.

Although about 60% of the players are from 4 states, the key players from the quarterfinalists were from 24 states.


NU

PSU

Purdue

Stanford

Texas

USC

U of W

Wisconsin

Total

 AL    

1


1

 AR

1

1

CA

1

1

4

5

4

15

 CO

1

1

 FL

1

1

 HI

2

2

 IA

1

1

 IL

2

2

1

4

9

 IN

6

1

7

 KY

1

1

 LA

1

1

 MD

1

1

 MI

1

1

 MN

2

2

 MO

1

1

 NB

2

2

 NC

1

1

1

3

 NJ

1

1

 NY

1

1

 OH

2

1

3

 OK

1

1

2

 OR

2

2

 TX

1

1

1

5

2

1

11

 WA        

1

1


2

 TOTAL

8

9

11

8

10

9

8

9

72


The data illustrates that quality programs are developing high performance players in most parts of the country.


Big Ten Dominates NCAA Women’s Volleyball Championships

On December 5th, 64 teams kicked off regional play for the 33rd NCAA women’s volleyball tournament. Teams represented 31 conferences; however, the tournament was essentially a competition between the Big Ten and the Pac 12.

There were 4 Big 10 teams and 3 Pac-12 teams in the quarterfinals. Although Penn State defeated Wisconsin in the finals, the match of the tournament saw Penn State defeat Stanford after being down 9-6 in game 5.

Michigan was the only Big Ten team that did not win a match. All other teams had winning records and conference teams won a total of 23 matches while losing 7.

Big Ten

Won

 Lost

Penn State 6 0
Wisconsin  5 1
Purdue  3 1
Nebraska  3  1
Illinois  2  1
Michigan State  2  1
Minnesota  2  1
Michigan  0  1
Conference Total  23  7


The Pac 12 was also well represented by 9 teams. Only ASU didn’t win a round and 5 teams won a match before bowing out. Conferences teams were 15-9 in championships.


PAC 12

Won

Lost

Washington

4

1

Southern California

3

1

Stanford

3

1

Arizona

1

1

California

1

1

Colorado

1

1

Oregon

1

1

Utah

1

1

Arizona St.

0

1

Conference Total

15

9


The Big Ten and Pac-12 teams won 38 of the 63 matches played in the championships. That is dominance!

Five of the 8 teams representing the SEC won their first round match, but lost in the second round. Overall the conference had a modest performance.

SEC

Won

Lost

Florida

1

1

Kentucky

1

1

LSU

1

1

Missouri

1

1

Texas A&M

1

1

Alabama

0

1

Arkansas

0

1

Georgia

0

1

Conference Total

5

8


Of the 4 ACC teams, only Florida State posted a winning record.


ACC

Won

Lost

Florida St.

2

1

Duke

1

1

Miami (FL)

0

1

North Carolina

0

1

Conference Total

3

4


The Big 12 was represented by 4 quality teams.


Big 12

Won

Lost

Texas

4

1

Kansas

2

1

Oklahoma

1

1

Iowa St.

0

1

Conference Total

7

4


There were 4 conferences that had a total of 8 teams. Each of these had representatives in either the round of 16 or 32.

School

 Conference

Won

Lost

Hawaii Big West

1

1

Cal St. Northridge Big West

1

1

UC Santa Barbara Big West

0

1

San Diego West Coast

2

1

BYU West Coast

2

1

Marquette Big East

1

1

Creighton Big East

1

1

American Univ. Patriot

2

1

Total

10

8


In total, the 41 teams that represented these 9 conferences had a combined record of 63-40.

Then there were the other 23 teams from 22 conferences. Generally speaking, these teams were admitted to the tournament because they were conference champions. While these teams and conferences all have solid programs, they are not competitive with the top teams or conferences.

None of the teams from these conferences won a match. In fact they only won 6 sets while losing 69 sets. Only Colorado State played a “close” match, losing 3-2 to Cal State Northridge.


School Conference Sets Won Sets Lost
Louisville AAC

0

3

New Hampshire America East

0

3

Duquesne Atlantic 10

0

3

Jacksonville Atlantic Sun

0

3

Idaho St. Big Sky

1

3

Charleston So. Big South

1

3

Radford Big South

0

3

UTSA Conference USA

0

3

Milwaukee Horizon

0

3

Yale Ivy

1

3

Fairfield Metro Atlantic

0

3

Ohio Mid-American

0

3

Hampton Mid-Eastern

0

3

Wichita St. Missouri Valley

1

3

Colorado St. Mountain West

2

3

LIU Brooklyn Northeast

0

3

Morehead St. OVC

0

3

Ga. Southern Southern

0

3

Central Ark. Southland

0

3

Alabama St. Southwestern

0

3

IUPUI Summit

0

3

Texas St. Sun Belt

0

3

New Mexico St. Western Athletic

0

3

Total

6

69


It is clear from the results that there are two if not three or four tiers of play within the NCAA Division I teams. The good news is that these 64 programs offer athletic opportunities for 600-700 of the country’s top women volleyball players.

Congratulations to Penn State on their championship season!


Buffs Volleyball Attendance on the Rise

The University of Colorado became a member of the PAC 12 Conference in 2010 and began competition in 2011. In most sports, the Buffs demonstrated they were not ready for prime time. Volleyball was no exception.

The Lady Buffs won only 1 of 22 matches in their first season. The home court was marginally more friendly to the Buffs than the road. They lost eight matches by a score of 3-0 and won a total of 5 sets in the friendly confines of the Coors Event Center. On a positive note, they won their only conference match at home.

Only once during the season were more than 1,000 people in attendance at the matches in 2011.


Date Opponent Score Attendance
Sep-13 Utah

0-3

508

Sep-23 Oregon

0-3

507

Sep-24 Oregon State

0-3

483

Sep-30 USC

0-3

923

Oct-2 UCLA

0-3

710

Oct-14 Arizona

0-3

923

Oct-15 Arizona State

0-3

643

Nov-3 Stanford

1-3

686

Nov-5 California

1-3

2,060

Nov-18 Washington State

3-2

635

Nov-19 Washington

0-3

876

Home Conference Record

1-10

Conference Record

1-21

Average Attendance

814

The 2012 season was marginally better. The Lady Buffs lost all their road matches, but won 4 home matches. Through increased promotional efforts and greater interest in the team, attendance surpassed 1,000 on four occasions.

Date Opponent Score Attendance
Sep-19 Utah

3-0

415

Sep-22 California

2-3

704

Oct-5 Washington State

3-0

757

Oct-7 Washington

0-3

712

Oct-12 Arizona State

3-2

3,117

Oct-14 Arizona

1-3

2,851

Oct-26 Oregon

0-3

701

Oct-28 Oregon State

3-1

607

Nov-9 UCLA

0-3

1,257

Nov-10 USC

0-3

1,140

Home Conference Record

4-6

Conference Record

4-16

Average Attendance

1,226

On the court, the 2013 season was a breakthrough year as the Lady Buffs posted a winning home record.

Date Opponent Score Attendance
Sep-27 UCLA 3-2

2,777

Oct-4 Washington 3-1

873

Oct-6 Washington State 3-1

851

Oct-25 Arizona 3-0

784

Oct-27 Arizona State 3-1

618

Nov-8 Stanford 0-3

1,562

Nov-9 California 1-3

1,127

Nov-22 Oregon State 3-0

863

Nov-24 Oregon 1-3

1,270

Nov-27 Utah 3-2

967

Home Conference Record

7-3

Conference Record

9-11

Average Attendance

1,169

The Lady Buffs have made progress; both on the courts and in the promotion of the program; however, the University of Washington has set a benchmark for CU and other conference members.

In addition to winning the 2013 PAC-12 title, the Huskies average attendance was over 3,800. Only twice was their home attendance less than 2,000.

Date Opponent Score Attendance
Oct-11 Arizona 3-1

4,589

Oct-13 Arizona State 3-0

2,188

Oct-16 California 3-0

1,525

Oct-20 Stanford 3-2

4,914

Nov-1 Utah 3-1

2,115

Nov-3 Colorado 3-0

2,880

Nov-13 UCLA 3-0

1,734

Nov-15 USC 3-1

4,274

Nov-27 Oregon State 3-1

2,139

Nov-29 Washington State 3-0

3,811

Home Conference Record

10-0

Conference Record

18-2

Average Attendance

2,842

Best wishes to the Buffs for a productive offseason and for continued improvement in 2014.

Buffs volleyball attendance on the rise
Nicole Edleman sets Kerra Schroeder in warmups

NCAA Volleyball – 33 Years in a Row for Stanford and Penn State

There was a time when baseball fans hollered, “Break up the Yankees.” At the time, it was an understatement to say that the Bronx Bombers were dominant.

If these anti-Yankee folks were women’s volleyball fans today they would say, “Break up the Penn State and Stanford programs.”

The first NCAA championships were held in 1981. In the 33 championships, including this season, Penn State and Stanford are the only two teams to appear in every NCAA tournament. That type of dominance makes the New York Yankees look as inept as the Chicago Cubs.

Over the past 33 seasons, Stanford has won 6 NCAA national championships and was runner-up on 8 occasions. As well, they had three undefeated conference seasons.

Since 1981, the overall winning percentage for the Cardinal fell below 65% twice. Their conference winning percentage dropped below that mark only once.

Penn State has been equally as impressive. They won 5 national championships and were runner-up on 3 occasions. They won the national championship four consecutive years (2007 – 2010) and were undefeated in two of those seasons.

As well, they were undefeated in conference play 14 times. Only once did the Penn State overall season winning percentage drop below 65%.

33 years in a row
Sunday evening Texas was announced as the number one seed for the 2013 NCAA tournament. They are the outright favorite to defend their title.

Penn State was seeded second and Stanford was seeded seventh. If they both win their first three matches they will face off in the quarterfinals.

Here’s to an exciting NCAA tournament!


Lady Buffs Volleyball Makes Headway with Mix of In-State and Out-of-State Players

The 2013 Lady Buffs Volleyball team posted its first winning season since 2006, by winning 17 matches and losing 13. In conference play, they were only 9-11; however, one of those wins included an upset of Washington, the eventual conference champion.

In 2006 the team was 17-12 overall and 12-8 in the Big 12 Conference. That year they were the only blemish on Nebraska’s record. The Cornhuskers were both Conference and National Champions.

The 2006 Lady Buffs featured a mix of talented out-of-staters (Alex Buth, Lauren Schaefer, Callie Webster, Ashley VenHorst, Austin Zimmerman, and Mallori Gibson) and Colorado residents:

  • Kaitlyn Burkett – Colorado Springs
  • Lara Bossow – Vail
  • Kristin Karlik – Colorado Springs
  • Amber Nu’u – Aurora
  • Ashley Nu’u – Aurora
  • Amber Sutherland – Glenwood Springs.

    lady buffs volleyball
    Nicole Edelman sets Nikki Lindow.

The team closed out the season with a loss to the Washington Huskies in the round of 32 in the NCAA tournament.

There have been six very long years for Buff fans and players between 2007 and 2012. Overall, they won 29.9% of their matches, 52-122. Their conference record was abysmal, 18-104; they won 14.8% of their matches.

Major contributors to the 2013 Lady Buffs team also included a mix of out-of-state players (Kerra Schroeder, Elysse Richardson, Alexis Austin, Joslyn Hayes, and Neira Ortiz Ruiz) and top Colorado players:

  • Emily Alexis – Brighton
  • Jessica Aschenbrenner – Denver
  • Nicole Edelman – Boulder
  • Kelsey English – Colorado Springs
  • Nikki Lindow – Erie
  • Cierra Simpson – Colorado Springs
  • Taylor Simpson – Colorado Springs

It is great to see a Colorado D1 program have success on and off the court, but it is even more special when it includes so many in-state players.  Go Lady Buffs Volleyball!

Volleyball No Longer a Sport for Less Athletic and Older Men

In 1895 William Morgan invented the sport of volleyball to provide the less athletic and older male members of the YMCA with a sport that required a lower level of athleticism and effort. His intent was to give them an opportunity to participate in an activity that wasn’t as rough and rigorous as basketball. In his initial demonstration of the sport, Morgan played on a 6’6″ net with 5 players on each team.

In 1900, Spalding produced the first ball specific to the sport. Twenty years later the 3-hit and back row attack rules were put in place. Volleyball was first played as an Olympic sport at the Tokyo summer games in 1964. Since then the popularity of the sport has increased dramatically because of Title IX, which was passed in 1972. Today about 23% of adolescent girls play volleyball on an organized team.

Data produced by the National Sporting Goods Association shows that about 60% of the players are women and the majority of participants are younger players. When a comparison is made between the age categories for volleyball and all sports and leisure activities, it is evident volleyball participation drops off when players reaches their 30s.

In fact, 41.8% of players are between the ages of 7 and 17 and another 18.4% are between 18 and 24. Combined, slightly more than 60% of players are under the age of 25. At the other end of the spectrum only 4.3% of all volleyball players are 55 years or older.

The remainder, 35.5%, are between the ages of 25 and 54 years.

If William Morgan was alive today, he probably wouldn’t recognize the sport he invented and the demographics of its participants, but given the sport’s popularity and its original intent, that is probably a good thing.
volleyball

Lady Buffs Volleyball Deserves Better Attendance!

Historically, University of Colorado Lady Buffs volleyball fans have been spoiled. The lady spikers have been a member of the Big 8, Big 12, and PAC -12, arguably the best volleyball conferences in the country.

Most years the Buffs have fielded a competitive team, on occasion they have upended nationally ranked teams, and they have infrequently paid a visit to the NCAA championships.

Given the competitiveness of the program it seems only logical that attendance at home matches would be strong. Unfortunately, Boulder is a town that loves sports, but in the case of volleyball, the locals would rather play it than watch it.

A total of only 12,261 people attended all 10 home PAC-12 games during the 2012 season. By comparison, the record number of people to attend a single men’s basketball game is 11,363. The individual game attendance for 2012 was:

  •    415                  Utah
  •    704                  California
  •    757                  Washington State
  •    712                  Washington
  • 3,117                  Arizona State
  • 2,851                  Arizona
  •    701                  Oregon
  •    607                  Oregon State
  • 1,257                  UCLA
  • 1,140                  USC

In 2012, CU was 4-16 in PAC-12 play; however, they were very competitive at home, winning 4 of the 10 matches in the Foam Dome, aka the Coors Event Center.

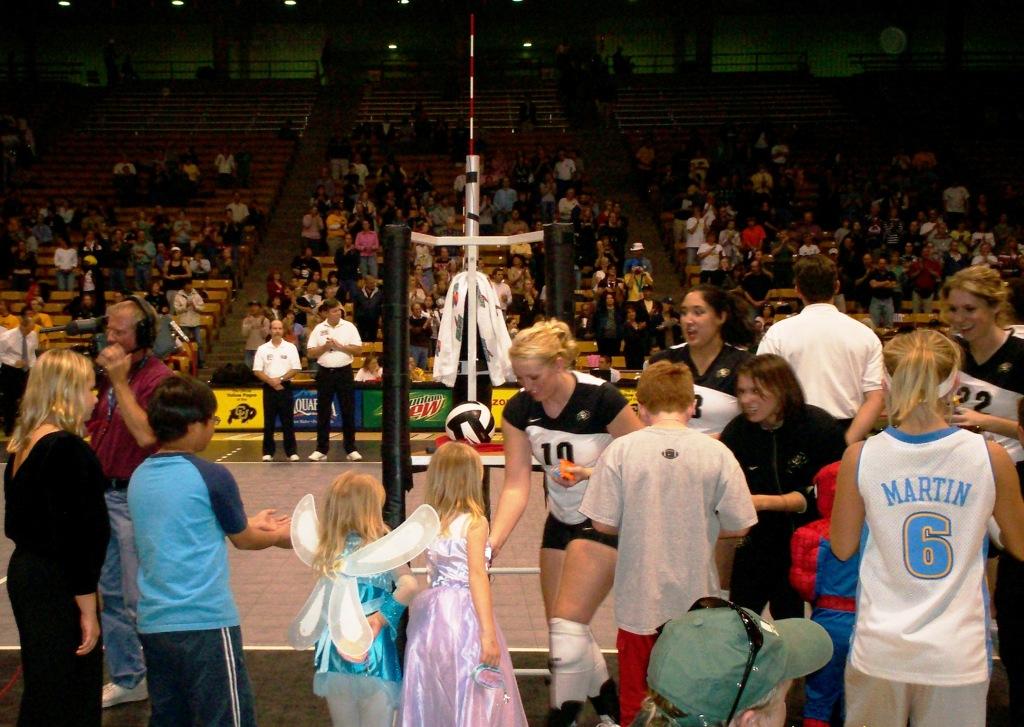
Average attendance was 1,226 spectators per home PAC 12 game, including two extremely popular promotional nights (In the photo below players hand out goodies to fairies and princesses prior to a Halloween promotional game). Without the promotional nights average attendance was 787 people.

There are still plenty of opportunities in the 2013 season to watch the Buff spikers compete against the best teams in the country. Go Lady Buffs Volleyball!

Lady Buffs Volleyball


Will Beach Volleyball Eliminate the Six-Person Game?

A year ago at this time, Americans were glued to their television sets watching the 2012 London Olympics. Women volleyball fans enjoyed a double dose of winning as the American women’s team captured a silver medal and Misty May-Treanor and Kerri Walsh-Jennings slipped past teammates April Ross and Jen Kessy to win gold and silver medals for the United States.

The dominance by the American women drew greater attention to the sport and will likely cause girls and young women to pursue the sport.  In the book Talent and the Secret Life of Teams, Terry Pettit discusses the future of beach and team (six-person) volleyball.

The following excerpts from the chapter, “Make Room for the Beach” describes where he thinks the sport is headed. (Note: the book was written in 2008.)

The possibility that women’s beach volleyball could become a sanctioned NCAA sport is intriguing to me because the results of such a decision could impact indoor volleyball in ways that we haven’t imagined. Never underestimate the attraction of an environment where scantily clad coeds can be watched without the threat of arrest or restraining order. If you could add a ten-minute halftime show where fraternity lads blow up cats wearing the opponent’s school colors, we might finally attract undergraduates to a non-revenue sport.

I believe that with the arrival of women’s beach volleyball there is a good chance that the indoor six-person game might go the way of six person women’s basketball, meaning that there may be a few outposts in Nebraska, South Dakota, and areas of the country with a significant Amish population that would continue to play it, but it would be deader than keeping one foot on the floor on date night at the collegiate level. ­­­­­­­­­­­­­­­­­­­­­

Why? Beach volleyball has one significant advantage over the indoor game. The biggest challenge in indoor volleyball is that we had too many people on the court. In basketball there are five players and 5000 square feet to cover. In volleyball there are six people and 900 square feet. Player can’t take three steps without running into a teammate standing up in her base position.

Athletic directors and coaches might favor beach volleyball over indoor volleyball because they mistakenly believe their team would have the opportunity to be more nationally competitive in the two woman game. They’re thinking would go like this: we aren’t able to recruit the explosive 6’4″ players that are required to advance to a Final Four; we have a better chance of landing those 5’9″ kids who are great ball handlers.

They would be wrong. How many truly great liberos have you seen in the past five years? Just because someone is less then 5’9″ tall, plays volleyball , and is explosive does not guarantee she can handle the ball any better than the kid bagging the ice cream on top of your bread at your local Piggly Wiggly. While junior volleyball has impacted technical skills, bracelets and T-shirt sales, and the pocketbooks of qualifier hosts, it has not done much to teach court awareness and a sense of the game. The few extraordinary ball handlers available are going to be recruited by the same schools that are getting commitments today from the kids blessed with vertical jumps and arm speed.

Each university can choose the type of sand it plays on. The texture can vary from heavy river sand in the upper Midwest to pea gravel in southern Illinois to the ground microscopic snails of Hawaii’s north shore. City universities can play on chipped asphalt and glass, and Ivy League schools on anything you can compost.

Fans admitted to a beach volleyball event would have their fingerprints scanned upon entry, making it easier to identify and locate the stalkers and sex offenders who are less likely to purchase season tickets to women’s sports where the athletes are covered with armor, like fencing and lacrosse. 

Finally, every host school is allowed to say over the beach public address system when the matches begin, “Welcome to the Beach!” Even if the nearest ocean is the one where the ice is melting faster than the coach can signal for a sub after a shanked serve.

Without a doubt, beach volleyball will continue to increase in popularity, but will it be the format of choice in years to come?  The industry is too entrenched in the six-person game, i.e. from a business perspective that seems unlikely.

Click here for additional information about Pettit’s book.

<img< a>