PAC-12, Smack 12 – Best Volleyball Conference?

PAC-12, Smack 12 – for a number of years, smack talkers from the West have claimed the PAC-12 is the top collegiate volleyball conference in the country. At times that has been true; however, that wasn’t the case in 2015.

Without a doubt the Big 10 was the country’s elite collegiate volleyball conference this season. The following table shows the win-loss records for the NCAA teams from the Big 10.

Team Record
Nebraska 6-0
Minnesota 4-1
Illinois 2-1
Ohio State 2-1
Penn State 2-1
Wisconsin 2-1
Michigan State 1-1
Michigan State 1-1
Purdue 1-1

Not only did the tournament champion come from the Big 10, but six of the conference teams had winning records and all of the Big 10 teams won matches.

The Huskers won six matches – three were 3-0 and three were 3-1. Their dominance was impressive given the depth of the field.

Looking ahead to next season, you have to feel sorry for the Big 10. The leading hitter for Nebraska was Kadie Rolfzen (412 kills) and right behind her was Mikaela Roecke (386 attacks). Rolfzen is a junior and Roecke is a freshman.

Amber Rolfzen led the team in blocks (182) and Kelly Hunter led the team in assists (1,501). Rolfzen is a junior and Hunter is a sophomore. The chances are pretty good that Nebraska will have a “decent” team in 2016.

Sixty four teams played in the NCAA championships. These teams represented thirty-two conferences.

The following 20 teams and conferences were at the bottom with 0-1 records.

University Conference
• SMU American Athletic Conference
• New Hampshire American East Conference
• Lipscomb Atlantic Sun Conference
• NAU Big Sky
• Coastal Carolina Big South Conference
• UNC Wilmington Colonial Conference
• Cleveland State Horizon League
• Fairfield Metro Atlantic
• Ohio Mid-American Conference
• Howard Mid-Eastern Athletic Conference
• Colorado State Mountain West
• Robert Morris Northeast Conference
• Belmont Ohio Valley Conference
• Furman Southern Conference
• Texas A&M Corpus Christi Southland Conference
• Jackson State Southwestern Athletic Conference
• Arkansas State Sun Belt
• Harvard The Ivy League
• Denver The Summit League
• NMSU WAC

In addition, the PAC-12 and Missouri Valley Conference were leaders for the number of teams with first round losses. Both had three, followed by the Big 12 with two. The ACC, SEC, WCC, and Big East also had teams that bowed out in the first round.

Only 12 conferences had teams that won matches and only six conferences had winning records.

Conference Record
Big 10 21-8
Big 12 10-5
PAC-12 9-7
SEC 5-4
WCC 5-4
Big West 3-1
Big East 3-3
ACC 3-4
Atlantic 10 Conference 1-1
Conference USA 1-1
Patriot League 1-1
MVC 1-4

Only 16 of the 64 teams had winning records

University Conference Record
Nebraska Big 10 6-0
Texas Big 12 5-1
Minnesota Big 10 4-1
Kansas Big 12 4-1
Hawaii Big West 3-1
USC PAC-12 3-1
Washington PAC-12 3-1
Florida SEC 3-1
Illinois Big 10 2-1
Ohio State Big 10 2-1
Penn State Big 10 2-1
Wisconsin Big 10 2-1
Creighton Big East 2-1
UCLA PAC-12 2-1
BYU WCC 2-1
Loyola Marymount WCC 2-1

While it is entertaining to play with the data and talk smack about which conference is best, the most impressive aspect of the 2015 NCAA Championships was the number of quality players on all teams.

Congrats to the Cornhuskers and Big 10 on a great season!
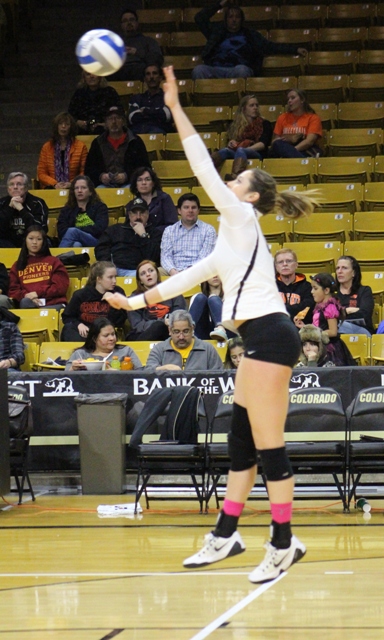
Lady Buffs Volleyball Wins and Attendance Peaked in 2014

The CU Lady Buffs volleyball team peaked in 2014.

There was a small group of players who raised their level of play in 2015. Unfortunately, their efforts were not enough to carry the Lady Buffs volleyball team to the NCAAs. To add insult to injury, the average size of the crowds in 2015 was less than during the previous season.

CU Lady Buffs Volleyball
Setter Nicole Edelman led the CU Lady Buffs Volleyball team to two NCAA tournaments during her career.

The University of Colorado became a member of the PAC-12 Conference in 2010 and began competition in 2011. During their first two seasons the Lady Buffs volleyball team was the doormat for the league; however they won slightly more than half their conference matches for the 2013 – 2015 seasons.

The Lady Buffs won only 1 of 22 conference matches in their first season. On a positive note, they won their only conference match at home. Since the first year, there has been steady improvement on the court and in the stands. The Lady Buffs were:
• 1-21 in 2011.
• 4-16 in 2012.
• 9-11 in 2013.
• 11-9 in 2014.
• 11-9 in 2015.
In five PAC-12 seasons they have had three losing conference seasons and were selected for two NCAA appearances. They won 36 conference matches and lost 66. The Lady Buffs reach a plateau in 2014.

Their home court conference record also got better. The Lady Buffs were:
• 1-10 in 2011.
• 4-6 in 2012.
• 7-3 in 2013.
• 6-4 in 2014.
• 7-3 in 2015.
The Lady Buffs have won 25 home matches and lost 26 in five seasons. On the road they were 11-40.

Finally, their average attendance at conference home games showed steady gains until 2015. Attendance at the Lady Buff home matches was:
• 814 in 2011.
• 1,226 in 2012.
• 1,169 in 2013.
• 1,452 in 2014.
• 1,395 in 2015.
With the exception of the Oregon match, more than 1,000 players were in attendance at all home matches. Unfortunately there were no matches where the Buffs had more than 2,000 fans in attendance.

Lady Buffs Volleyball Home Conference Attendance 2015

Date Opponent Score Attendance
9-Oct USC 2-3 1,899
11-Oct UCLA 0-3 1,972
16-Oct California 3-1 1,432
18-Oct Stanford 3-1 1,809
30-Oct Oregon State 3-2 1,116
31-Oct Oregon 2-3 948
12-Nov Arizona State 3-2 1,672
14-Nov Arizona 3-0 1,029
25-Nov Washington State 3-2 1,055
27-Nov Utah 3-1 1,021

Best wishes to Coach Mahoney and the Lady Buffs volleyball program for a productive offseason and for continued improvement in 2016. The program deserves better support than it has seen in the past.

Lady Buffs Volleyball Staying Home this Postseason

On Sunday, the NCAA announced the field for their 2015 women’s volleyball championships. The field of 64 included 32 automatic berths for conference championships and an equal number of at-large slots.

The Big 10 has bragging rights for the most number of teams (10) followed by 7 PAC-12 teams and 5 Big 12 teams. The top seeds were: No. 1 University of Southern California, No. 2 University of Minnesota, No. 3 University of Texas, and No. 4 University of Nebraska.

The announcement of the field took an unexpected turn for Colorado Buffs fans. The hometown team finished fifth in the PAC-12 with an 11-9 conference record and a 19-13 overall record. Despite their showing, the Lady Buffs were not invited to attend the Big Dance – yet invitations were extended to the 6th place Ducks (10-10 in conference and 16-13 overall), 7th place Wildcats (9-11 in conference and 19-13 overall) and 8th Sun Devils (8-12 in conference and 19-12 overall).

Here’s the way the conference season unfolded for CU:
• On a positive note, the Buffs swept Arizona, California, and Oregon State.
• The Buffs split matches with Arizona State, Oregon, Stanford, and Utah.
• The Buffs lost one match to Washington and defeated Washington State in one match.
• The Buffs were swept by USC and UCLA

The Buffs played 6 matches with a score of 3-2.
• They defeated Arizona State, Oregon, Oregon State, and Washington State.
• They lost to Oregon and USC.

In pre-conference play, the Buffs were 8-4. They were swept by Penn State (8th at the end of the season) and Illinois (21st at the end of the season). They dropped a 3-1 match at home to San Diego, who received votes in the final rankings. The Buffs other loss came at the hands of Rice, 3-1.

On a positive note, the Buffs had a 3-2 win over Florida State (ranked 19th at the end of the season). The other wins were against teams they shouldn’t have been playing:
• Oklahoma 12-16
• Sam Houston State, 14-18
• Louisiana-Lafayette, 6-23
• Montana State, 3-21
• Weber State, 6-22
• George Mason, 10-19
• Air Force, 12-21.
Combined these 7 teams were 63-140; they won 31.0% of their matches.

The Buffs had “good wins” against Stanford and FSU and at the end of the season they received votes for the top 25. A strong case can be made that the Lady Buffs were a legitimate top 32 team, i.e. they should have been invited to the Big Dance.

A strong case can be made that the Lady Buffs were a legitimate top 32 team, i.e. they should have been in the Big Dance.

If you consider the non-conference “bad losses” to Rice and San Diego and the conference losses to Oregon, Utah, and Arizona State, a strong case can be made that the Lady Buffs should stay at home.

The moral of the story is that competition against good teams and consistency matter!

Lady Buffs Sweep California
Lady Buffs sweep California.


Weak Volleyball Coaches or Too Many Programs – North Metro

There is concern among volleyball parents in the North Metro/Northern Colorado area (north or I-70) that the overall quality of the club and high school volleyball programs is  weaker than other parts of the Front Range.

Discussions with club directors and high school coaches say there are plenty of good coaches, but there are too many programs. That means there aren’t enough good players for all the programs. They also point out that the sport is growing and there is greater depth. That means there is more equity among the teams.

Let’s take a look at how the North Metro/Northern Colorado teams did in the regional and state tournament.

In the CHSAA 5A regional playoffs the Northern teams were represented by 9 teams and they were 6-12 in match play. Sadly, only Fairview advanced to state.

Region School Record in Regionals
3 Fossil Ridge 1-1
4 Loveland 1-1
5 Poudre 0-2
6 Brighton 0-2
6 Legacy 0-2
7 RockyMountain 1-1
8 Fort Collins 0-2
9 Boulder 0-2
11 Fairview 1-1
Total Northern 5A 6-12

Fairview represented the North Metro area/Northern Colorado well by finishing second at state. They were 3-2  in the tournament. They won 9 sets and lost eight and they won 50.3% of the points played (384-379).

The following table shows that Northern 4A teams had a strong showing in the regional championships. Nine of the 36 teams in the regional competition were from the northern region and 6 of the teams qualified for state. The northern 4A teams were 16-7 in match play.

Region School Record in Regionals
1 Weld Central 0-2
4 Holy Family 2-0
4 Niwot 1-1
6 Longmont 2-0
7 Windsor 2-0
8 Erie 1-2
8 Silver Creek 3-1
11 Berthoud 2-0
12 Mead 3-1
Total Northern 4A 16-7

Note: Erie, Silver Creek, and Mead had playoffs in their pool play. Silver Creek and Mead advanced to state.

On the first day of the state tournament, the 4A teams played 7 matches and were 0-7. They did not even win a set. Silver Creek was the only North Metro/Northern Colorado team to win a set against a team from outside that region when they lost 3-1 to Delta.  Overall, the teams from the Northern area were 2-10, with the only wins coming against teams from the region.

School Matches W-L Sets W-L Points W-L % Points Won
Holy Family 0-2 0-6 97-150 29.3%
Longmont 1-1 3-3 136-141 49.1%
Windsor 1-1 3-4 132-147 47.3%
Silver Creek 0-2 1-6 123-169 42.1%
Berthoud 0-2 0-6 113-150 43.0%
Mead 0-2 1-6 117-172 40.5%
Total – Northern 4A 2-10 9-36 718-929 43.6%

There are a number of strong players in the North Metro/Northern Colorado region. However, with the exception of Fairview they were not competitive with the top teams in the state. Is the weak performance from the North a function of a shortage of strong coaches and club programs (as some parents claim) or is it a result of too many programs and not enough good players on a team (as the club directors suggest)? Good question.

USC’s Samantha Bricio Does it All

The following three tweets are from the University of Southern California women’s volleyball twitter account in their 3-1 victory over Oregon State University on October 23rd (25-20, 24-26, 25-16, 25-18). They provide valuable lessons for junior volleyball players.

There was a day when players were stereotyped – tall girls hit and blocked and short girls dug and set. Today all the players, no matter their height, have to do it all.

The first two tweets are about Samantha Bricio, a 6’2″ senior Outside Hitter from Guadalajara, Mexico.

Lesson 1: Bricio does it all!

USC W. Volleyball ‏@uscwomensvolley 8h8 hours ago
@samybricio finishes with 23K (.246) and 15 digs for her 10th double-double of the season. She also had two aces and three blocks #FightOn

Lesson 2: Bricio actually got her double-double just prior to the end of the second set. Bricio has been a consistent well-rounded player for a number of years.

USC W. Volleyball ‏@uscwomensvolley 9h9 hours ago
With 15K and 10D, @samybricio already has her 10th double-double of the season (50th career) through two sets#FightOn #vbscores

Lesson 3: When you are number one in the country, how do you lose a set 24-26 when you have 23 kills and a block? Guess you have to hit your serve in….oops!? (USC missed 5 serves in the second set.) You lose matches when you have unforced errors.

USC W. Volleyball ‏@uscwomensvolley 9h9 hours ago
USC hit .373 in set two and scored all 24 of its points (23K, 1B) but had five service errors | S2 Tied 1-1 #FightOn #vbscores.

bricio

Volleyball-a Good Investment for Your Daughter

At a recent girl’s recreation volleyball tournament a mother was carrying her daughter’s backpack that included a handmade sign warning about the alleged evils of a local volleyball club. Volleyball-A Good Investment for Your Daughter

During the entire tournament the mother sat by herself and did not talk to anyone. As she cheered for her daughter’s team she guarded her backpack and made sure the sign was visible to the entire crowd.

Clearly something went wrong with the relationship between the mother, her daughter, and the club. The purpose of this post is not to place blame on the club or the mother. Rather, the intent is to discuss ways to prevent the type of discord that exists in this situation.

The good news is that the daughter was still playing!

Mismanaged Expectations

The euphoria surrounding the club selection and tryout process may be problematic.

Many club directors are Type A personalities who are passionate about selling volleyball. They have good intentions and want to help young girls enjoy the sport and grow as athletes and individuals. Sometimes they are too passionate and may not accurately represent their club.

At the same time some parents are so excited about seeing their daughter on the court they do not hear or may not understand what the club director has told them. At younger levels many girls played volleyball for the first time in intramurals or their physical education class and want to continue playing when these seasons come to an end. In many parts of the country the next step for them is club volleyball even though the “appropriate next step” may be developmental club programs or strong recreation or short-term league programs.

Despite the good intentions of parents and club directors, in many instances, the problems associated with club volleyball are a case study of mismanaged expectations. In most cases misunderstandings could have been remedied by better communications from both the parents and club directors.

The management of expectations is critical to the future of the sport. It is tragic when girls quit playing volleyball because they are playing in a dysfunctional setting.

A Few Questions Parents Need to Ask

If parents ask the following questions and feel comfortable with the answers, they will increase the chances of having a positive club experience for their daughter.
• Does the club have open house sessions for the parents? Do they have open gyms so the kids can interact with the coaches and potential teammates? Are the instructors at the open gyms “showcase coaches” or will they be the actual coaches for your daughter?
• A key to a successful volleyball experience is playing on a team with a qualified coach who can relate to all of the players. If the coach cannot relate to your daughter then you may not have a good experience. For a variety of reasons, many clubs will not identify coaches prior to the start of the season. They defend this stance by saying, “All our coaches are great, besides you don’t get to pick your teachers when you go to public school, so it really doesn’t matter.” Depending on your perspective this may be a sufficient answer or it may raise a red flag. When people plan to spend $2,500+ for their daughter to play volleyball, they should know who the coach is. Would you buy an appliance, furniture, or used car for that amount without looking at it up close? Who is going to coach your daughter?
• Most club coaches are great people who lack sufficient training to adequately coach the sport for a season that lasts six months. Compensation for most coaches is minimal. Club coaches are required to have background checks. In addition they must pass a four-hour IMPACT training class from the USAV. What are the credentials of the coaching staff beyond these basics? Does the club provide additional training for their coaches? Can you get additional instruction if you do not feel your daughter needs additional instruction outside the club program?
• What is the club’s philosophy? Do they play to win? Is their focus on being a recreational team? Do they believe in on court and off court training? Do they recruit only tall players? What is the coach’s philosophy? As a parent, can you live with the club philosophy and the coach’s philosophy?
• What skills are measured in the tryout? Are the tryouts open or closed? Will the kids find out why they did not make the team? Will the tryouts take into the account the potential of a player or the possible chemistry of the team when making their selections?
• What is the cost for playing on the team? What is included in that fee (uniforms, equipment, travel)? What are the undocumented costs of playing such as family travel to practices and tournaments? Does the club have scholarship programs?
• When are practices? What happens if a player misses practice? Do the players stand in line during practice? Are players punished when they make a mistake? Can parents watch practices? Is conditioning part of practice time or is it separate? Are there club activities other than practice such as film reviews, good will projects in the community, outside training, special seminars, attendance at other matches?
• What is your reason for playing club volleyball? Recreation? Instruction? Camaraderie? College scholarship? Is this club a good fit for your daughter and your pocketbook? Do you have the patience to deal with the parents and your daughter’s teammates – some may become BFFs, while others may be at the opposite end of the spectrum. Is club volleyball appropriate for your daughter? Can parents buy playing time or positions on the team for their daughters?
• When are tournaments? Is playing time guaranteed? How is the starting lineup established?
• Is communications a critical part of the program? What is the role of the parent in communications with the coach? How should the players approach the coach when they have a problem?

Think “Volleyball-A good investment for your daughter.” If you Volleyball-A Good Investment for Your Daughter!answer these and other questions prior to committing with a club or other long-term program, then it is likely the sign you place on your daughter’s backpack would support the general virtues of having your daughter play organized volleyball in an appropriate program.

USA Women’s National Team Captures FIVB World Cup of Volleyball

On October 12, 2014 the USA Women’s National Team (WNT) did what no other American team has done before – they won the World Championships.

This post evaluates the percentage of points, sets, and matches won by the WNT and extrapolates lessons learned from the data.

The data shows:
• Overall – the USA WNT won 53.1% of the points, 75.0% of sets and 84.6% of matches in the 2014 World Championships.
• Early Rounds – In the first 8 matches the WNT won 55.2% of the points, 88.9 of the sets, and 100.0% of the matches.
• Late Rounds – In its last 5 matches the WNT won 49.7% of the points, 52.9% of the sets, and 60.0% of the matches. This was enough to win the World Championships.

USA Women's National Team

The lessons learned are:
• Champions win slightly more than half the points.
• Every point matters when you are only winning 53.1% of the points. Really dominant teams will win a higher percentage – 55% to 56%.
• Champions play every point as if it is the most important point of the match.
• Champions don’t get blown out. They are in every match – because every point is important.
• Champions manage team and player mistakes when they happen.
• Pre-tournament coaching makes a difference. At the USAV High Performance Coaches Clinic, Coach Kiraly talked about how he asked several players to replace their heavy topspin serves with jump floaters to increase the percentage of points won on the serve. These players began working on this change a month prior to the World Championships.
• Tournament preparation and establishing strategies make a difference. Because the WNT dominated in early matches they were able to allocate playing time across all their hitters. This meant their top hitters were rested for the final matches and opponents had difficulty scouting them.
• Understanding match data is part of the planning process for championship teams.
• Clearly, the WNT won this championships because the players worked together as a team and understood their role on the team.

Good luck to the USA Women’s National Team as they defend their title this August in Japan.

USA Women's National Team - points won, sets won, matches won

Two Points a Set – CU’s Long and Winding Road to Improvement

Since 2007, the University of Colorado Women’s Volleyball program has been challenged to put a team on the court that wins in conference play. This post presents data that documents the improvement made by the Lady Buffs from 2009 to 2014.

Background

In 2006 the Lady Buffs won 49.5% of the points in conference competition, they qualified for the NCAA Championships, and were ousted in the second round. Data for 2006 and 2007 are not included in this discussion because sets were played to 30 points at that time.

In 2007 CU only won a single conference match with virtually the same team that had won the first round in the 2006 NCAA Championships.

In 2008, the rules were changed and sets were played to 25 points. The fortunes of the Lady Buffs improved slightly – they won seven matches.

In 2009 changes were made in the CU program and Liz Kritza took over as coach. Her teams won six out of 62 matches in her first three seasons.

The Buffs switched to the PAC-12 Conference in 2011.

In the inaugural PAC-12 season there were 22 conference matches. For purposes of discussion in this post, the data for 2011 has been adjusted to make it comparable to other years. Twenty matches were played in 2012 and subsequent years.

In 2012 the Lady Buffs won four of twenty matches. They were victors half the time when their 2013 and 2014 totals are combined.

Results

The 2009 conference season was abysmal. The Lady Buffs were not competitive – they won their fewest number of points (1,205) and lost their least number of points (1,609).

To become a competitive team it was necessary for the Lady Buffs to win more points. At the same time they needed to lose fewer points.

As can be seen by fast forwarding to 2014, the Lady Buffs have made progress. IT IS IMPORTANT TO NOTE HOW SLOW THAT PROGRESS HAS BEEN.

They won half the points played in 2014, were 11-9 in conference play, qualified for the NCAA Championships, and won their first round match. For the sake of comparison, the 2014 points won/lost for CU, Stanford, and Nebraska follow:
• CU 1,651 points won and 1,648 points lost.
• Stanford 1,774 points won and 1,493 points lost. Stanford lost in the NCAA semis to champion Penn State.
• Nebraska 1,633 points won and 1,500 points lost. Nebraska lost in the NCAA quarters to finalist BYU.

As can be seen, the Lady Buffs are half-way to becoming an elite team. They are now winning about 1,600 points per season. Unfortunately, they have consistently lost at least 1,600 points per season since 2008. That total will have to be reduced to about 1,500 for CU to move to the next level.

Year Points Won Points Lost % Points Won Record
2008 1,512 1,707 47.0% 7-13
2009 1,205 1,609 42.8% 2-18
2010 1,302 1,639 44.3% 3-17
2011 adjusted 1,304 1,629 44.5% 1-21
2012 1,354 1,655 45.0% 4-16
2013 1,516 1,635 48.1% 9-11
2014 1,651 1,648 50.0% 11-9

Points Won by Year

In 2008 the Lady Buffs won 1,512 points. Point production dropped to 1,205 when the team cratered in 2009. It didn’t return to the 2008 level until 2013 when the team reached 1,516 points.

Year Points Won Difference Prior Year Avg. Diff. Points/Match Avg. Diff. Points/Set
2008 1,512
2009 1,205 -307 -15.4 -4.7
2010 1,302 97 4.9 1.3
2012 1,354 50 2.5 0.7
2013 1,516 162 8.1 2.2
2014 1,651 135 6.8 1.7

There was little change in the points won between 2010 and 2012. On average the Lady Buffs found a way to win 7-8 additional points each match or about 2 additional points per set throughout both the 2013 and 2014 seasons.

TWO POINTS A SET! That sounds so easy.

The data shows there is a fine line between the number of points won for a 4-16 team, a 9-11 team, and a team with an 11-9 record. For additional information, see the report Team Tendencies and the Importance of Winning a Point.

Two Points a Set

Percentage of Points Won – Stanford, Nebraska, and CU Volleyball

What is the difference in the percentage of points won for winners and losers?

The top teams in the country win slightly more than half the points they play in conference matches. At the other end of the pecking order the worst teams in the country win 40% to 45% of the points they play.

As expected, teams that win about half the points will win about half the sets and about half their matches.

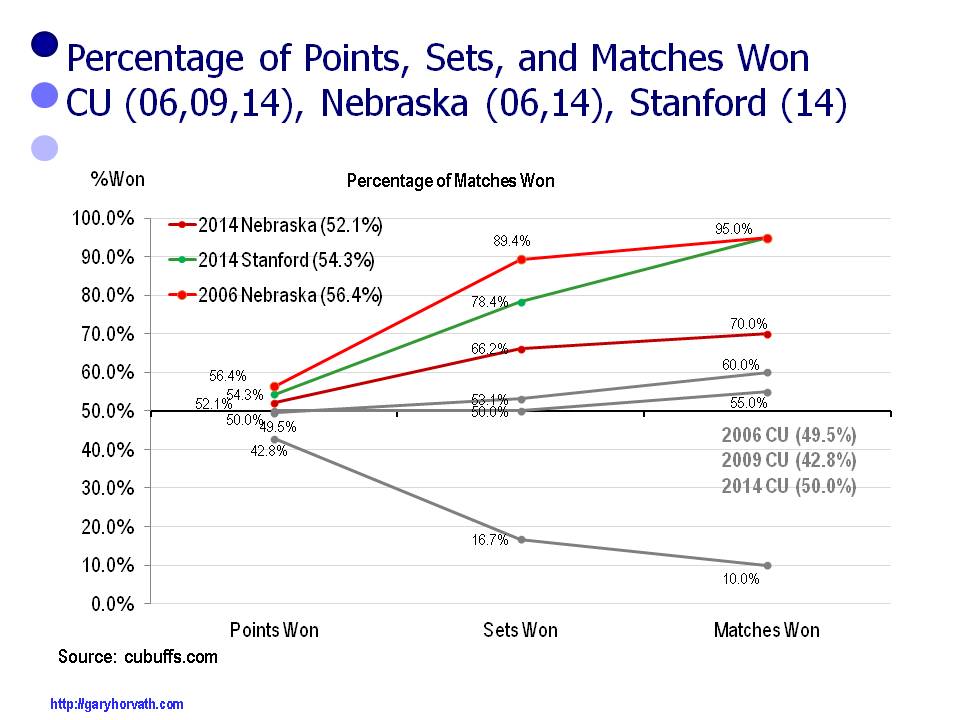
To illustrate this point, consider the 2006 and 2014 University of Colorado teams.

During the 2006 conference season the Lady Buffs won:
• 49.5% of the points
• 53.1% of the sets
• 60.0% of the matches.
During the 2014 season the Lady Buffs won:
• 50.0% of the points
• 50.0% of the sets
• 55.0% of the matches.
Both seasons the Lady Buffs were invited to the NCAA Championships and won their first round matches before bowing out.

When teams win less than half the points they win a much smaller percentage of the sets and an even smaller percentage of the matches. A prime example was the 2009 CU Lady Buffs.

During the 2009 season the Lady Buffs won:
• 42.8% of the points
• 16.7% of the sets
• 10.0% of the matches.
They had one of the poorest records in the country for Division I teams.

When teams win more than half the points those wins are magnified. A greater percentage of sets are won and an even greater percentage of matches are won.

During the 2014 season the Nebraska Cornhuskers won:
• 52.1% of the points
• 66.2% of the sets
• 70.0% of the matches.
The Cornhuskers lost 3-0 to finalist BYU in the quarterfinals of the NCAA Championships.

The 2014 Stanford Cardinal team won:
• 54.3% of the points
• 78.4% of the sets
• 95.0% of the matches.
The Cardinal lost to champion Penn State in the semifinals.

The 2006 Nebraska Cornhuskers won:
• 56.4% of the points
• 89.4% of the sets
• 95.0% of the matches.
The Cornhuskers were National Champions in 2006. Their only loss was to the Lady Buffs, a team that won less than half its points in conference play. Despite their one loss, this Husker team was incredibly dominant.

The data shows there is a fine line between the percentage of points won for the best and the worst teams in the country. For additional information, see the report Team Tendencies and the Importance of Winning a Point.

Percentage of Points Won - Stanford, Nebraska, CU

Women’s Volleyball Team Tendencies

The women’s volleyball scores for the University of Colorado were evaluated for the nine-year period 2006 to 2014. In addition, scores were included for select Nebraska and Stanford seasons. From this analysis points won, sets won, and matches won, the following team tendencies were developed.

The following definitions are used in the description of the different levels.
Blowouts – decided by 10 points or more.
Solid – decided by 5 to 9 points.
Competitive – decided by 3 or 4 points.
Close – decided by 2 points.

Tier I Teams
• Win more than 53% of the points.
• Don’t lose blowout sets and less than 10% of sets are solid losses. They don’t give opponents a chance to get into the match.
• Win a majority of the close and competitive sets.
• At least 35% of the sets are solid wins
• At least 10% of the sets are blowout wins.
• Win at least 80% of their matches and most wins are 3-0.

Tier II Teams
• Win between 50.1% and 53.0% of the points.
• May lose a few blowout and solid loss sets.
• Win a majority of close and competitive matches.
• About 30% of their sets are solid wins and 5% are blowouts.
• Win at least 66% of their matches and most wins are 3-0 or 3-1.

Tier III Teams
• Win 48.1% to 50% of the points.
• Less than 10% of sets lost are blowouts and 20% solid losses.
• Sometimes win a majority of the close and competitive matches.
• Win about 20% of the sets are solid wins
• May win a few blowout sets.
• Win about half their matches.

Tier IV Teams
• Win between 45.1% and 48% of the points.
• About 20% of their sets are blowouts and 25% are solid loses.
• Most losses are 3-0 or 3-1.
• Win about 35% of their sets and matches.

Tier V Teams
• Win less than 45.1% of their points.
• More than half their sets are solid losses or blowouts.
• A majority of their matches are lost 3-0.
• Win less than 30% of their matches.

The above hierarchy will allow coaches to identify where their team falls in the peaking order and provide them with coaching that will help them move up the pecking order.

For additional information, click here and go to the report Team Tendencies and the Importance of Winning a Point.