Top Sports in Colorado for High School Girls

What were the top sports for high school girl athletes in Colorado in 2014?

Data from the National Federal of State High School Athletic Associations (NFHS), https://www.nfhs.org/, shows that the top sports for girls, from an athletic director’s perspective, are basketball, volleyball, track and field, cross-country, and soccer. More than 300 Colorado schools have basketball, volleyball, and track and field programs and greater than 200 schools have cross-country, and soccer programs.

At the bottom of the list are field hockey and alpine and cross-country ski programs.

Sport Number of Schools with Programs
Basketball 329
Volleyball 318
Track and Field — Outdoor 302
Cross Country 230
Soccer 213
Competitive Spirit Squad 190
Softball — Fast Pitch 178
Golf 164
Tennis 153
Swimming & Diving 153
Lacrosse 81
Gymnastics 66
Skiing — Alpine 14
Skiing — Cross Country 14
Field Hockey 13

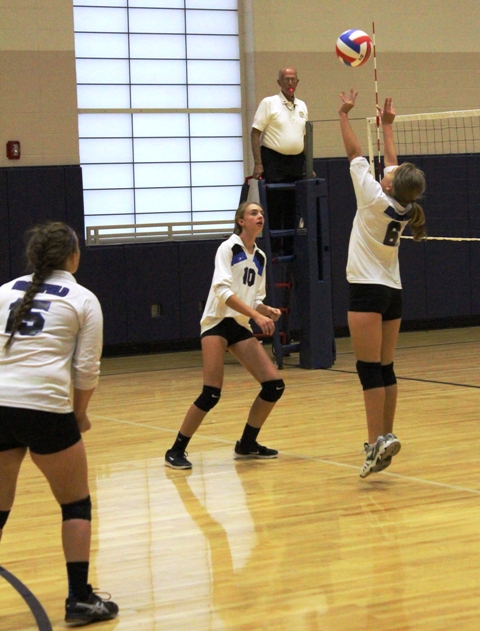
Top Sports in Colorado - Volleyball

From the athlete’s perspective the ranking is much different. Volleyball is overwhelmingly the most popular sport followed by soccer, track and field, basketball, and tennis.

Alpine and cross-country ski programs are clearly at the bottom.

Sport Number of Participants
Volleyball 9,097
Soccer 7,623
Track and Field — Outdoor 7,334
Basketball 7,089
Competitive Spirit Squad 4,810
Tennis 4,552
Swimming & Diving 4,142
Cross Country 3,957
Softball — Fast Pitch 3,724
Lacrosse 1,604
Golf 1,514
Field Hockey 592
Gymnastics 543
Skiing — Alpine 151
Skiing — Cross Country 100

The data showed there are 175 girls participating in boy’s wrestling, baseball, football (11,8, and 6 player), and Ice hockey. There were 85 in wrestling and 42 in baseball.
Football, Basketball, and Track – Top Sports in Colorado

What were the top sports in Colorado for boys in high school during the 2014 season?

Data from the National Federal of State High School Athletic Associations (NFHS), https://www.nfhs.org/, shows that the most popular sports, from an athletic director’s perspective, for boys are basketball, track and field, baseball, wrestling, and cross-country, and soccer. More than 300 Colorado schools have basketball programs. While just under 300 have track and field and baseball. If all levels of football (6,  8, and 11 player) are combined, then football is the third most popular sport.

Sport Number of Schools with Programs
Basketball 330
Track and Field — Outdoor 299
Baseball 279
Wrestling 240
Cross Country 230
Football — 11-Player 211
Soccer 211
Golf 189
Tennis 130
Swimming & Diving 118
Lacrosse 113
Ice Hockey 64
Football — 8-player 49
Football — 6-player 35
Skiing — Alpine 14
Skiing — Cross Country 14

At the bottom of the list are alpine and cross-country ski programs.

From the athlete’s perspective the ranking is much different. Despite concerns about concussions, football is overwhelmingly the most popular sport. It is followed by track and field, basketball, baseball, and soccer.  At that point there is a significant drop to wrestling, cross-country, and lacrosse.

Sport Number of Participants
Football — 11-Player 14,917
Track and Field — Outdoor 9,597
Basketball 8,764
Baseball 8,248
Soccer 7,770
Wrestling 4,978
Cross Country 4,068
Lacrosse 3,787
Tennis 2,868
Golf 2,145
Swimming & Diving 2,066
Football — 8-player 859
Ice Hockey 644
Football — 6-player 453
Competitive Spirit Squad 172
Skiing — Alpine 140
Skiing — Cross Country 117

Competitive spirit squad and alpine and cross-country ski programs are clearly at the bottom.

Highest Price Television Advertising – Sunday Night Football

Advertising Age recently released the results of its annual survey of the cost of prime time ads on the major networks. Because actual prices vary based on inventory levels and advertisers have different relationships with the network, the listed prices should be considered estimates.  football - highest priced television advertising

At the top of the list, by a long shot is Sunday Night Football. The highest price television advertising is a 30 second ad on Sunday Night Football. The cost is $627,300. Thursday Night Football is a distant second place at $483,333.

The following information is from a September 25 post by Jeanine Poggi. It shows the leaders by network.

Sunday
ABC – 8:00 Resurrection $140,378.
CBS – 7:00 60 Minutes $98,280.
NBC – 8:00 Sunday Night Football $627,300.
Fox – 8:00 The Simpsons $189,933.

Monday
ABC – 10:00 Castle $141,560.
CBS – 9:00 Big Bang Theory $344,827.
NBC- 10:00 The Blacklist $282,975.
Fox – 9:00 Sleepy Hollow $202,500.

Tuesday
ABC – 9:00 Marvel’s Agents of S.H.I.E.L.D. $157,254.
CBS – 8:00 NCIS $170,948.
NBC – 9:00 The Voice $253,840.
Fox – 9:00 New Girl $187,050.

Wednesday
ABC – 9:00 Modern Family $239,650.
CBS – 9:00 Criminal Minds $135,789.
NBC – 10:00 Chicago P.D. $122,000.
Fox – 9:00 Red Band Society $118,025.

Thursday
ABC – 9:00 Scandal $217,546.
CBS – 8:00 Thursday Night Football $483,333.
NBC – 9:00 Bad Judge $204,667.
Fox – 9:00 Gracepoint $170,275.

Friday
ABC 9:00 Shark Tank $109,878.
CBS 10:00 Blue Bloods $79,370.
NBC 9:00 Grimm $118,818.
Fox 8:00 Masterchef Junior $100,400.

Saturday
ABC 8:00 Saturday Night Football N/A.
CBS – 10:00 48 Hours $33,500.
NBC – Encores N/A.
Fox – Fox Sports Saturday N/A.

Despite the challenges the sport has faced off the field, the highest priced television advertising is for football. The sport remains at the top of the pile when it comes to capturing the top dollar.


Key Search Terms – Seat Size, Playing Time, Pro Sports

It is a common practice to use website tracking tools to identify search terms that drive people to a website or blog. Such an analysis was completed for this site as part of a move from a previous service provider.

The terms were grouped into categories and the top three search term concepts were:

  • Equal playing time.
  • The purpose of professional sports.
  • The size of stadium seats.

These search terms may not be representative of the beliefs of society as a whole; however, they are clearly issues that are relevant to society. The irony is that only a small portion of articles on this site address these topics.

Equal playing time has been a hot button for a number of years. Some parents feel equal playing time is necessary so their children, and all kids, can have an equal opportunity to improve. At the same time equal playing time prevents better and more dedicated athletes from getting the playing time they have earned though hard work. Parents are interested in understanding the arguments that can be made for and against equal playing time.

The purpose of professional sports is questioned by society every day. A look at attendance and revenue figures for professional sports teams shows that Americans love sports, yet they have become concerned about the purpose of sports because there is never ending media coverage of issues such as substance abuse, the concussion epidemic, compensation that seems to be exorbitant, cheating, scandals, and poor sportsmanship. It is difficult for some to come to terms with the fact that professional sports are the ultimate form of entertainment.

Seat size is obviously a major topic for the owners of arenas, stadiums, and event centers. Over time the weight of average Americans has increased significantly and stadium seats have been made wider to accommodate spectators. Has this gain in weight and the accompanying increase in the size of American derrieres caused a greater interest in the size of seats at local sports arenas?

It is understandable why the first two topics were included as hot topics in website searches; however, the volume of searches for seat size is more puzzling.

What search terms/concepts are going to be at the top of the list during the next year?

Stay tuned. It should be interesting.

Age Breakdown of Sports Participants

Recreation departments, sports manufacturers and retailers, coaching and trade associations, and athletic departments are interested in the age breakdown of sports participants. This information helps them develop customized equipment, services, programs, and coaching techniques to the sports participants in each age group. As well, age breakdown information provides valuable marketing insight that is used to promote goods, services, and the various sports.

The U.S. Statistical Abstract publishes sports participation levels by age groups using National Sporting Goods Association data. The 2012 publication provides 2009 NSGA information.

Key findings from the data show:

  • Soccer, baseball, basketball, and volleyball are predominantly youth sports.
  • Swimmers are split between two groups. Almost 42% are under 25 and about 45% are in the 25 to 54 age category.
  • Almost 57% of tennis players are in the 25 to 54 age group. A small percentage of tennis players are over the age of 55.
  • The breakdown of alpine skiers is similar to tennis; however, there are a higher percentage of older skiers than tennis players.
  • The sports of aerobic exercising, yoga, exercising with equipment, golf, and exercise walking have the highest percentage of older participants and the lowest percentage of youth participants. For each of these sports the percentage of participants in the 25 to 54 age category is between 54% and 65%.

sports participants

Sports Participation Rates by Gender

From a business perspective it is important to understand the breakdown of sports participation rates by gender. This information can be used for everything from developing equipment and coaching techniques that are gender specific to marketing goods and services to the players and teams.

The U.S. Statistical Abstract publishes sports participation rates by gender using National Sporting Goods Association data. The 2012 publication provides 2009 NSGA information.

Overall, the split between participants in all sports and leisure activities measured by NSGA is 49.1% male and 50.9% female. This is similar to the gender breakdown for the U.S. population.

The data shows the following sports have a higher percentage of male participants:

  • Baseball
  • Golf
  • Basketball
  • Alpine skiing
  • Soccer
  • Tennis.

On the other hand, the following sports have a higher percentage of female participants:

  • Exercising with equipment
  • Swimming
  • Volleyball
  • Exercise walking
  • Aerobic exercising
  • Yoga.

More current information will be available in the 2013 Statistical Abstract or it can be purchased from NSGA; however, variances from the 2009 data are likely to be minimal.


What Sports do Adolescent Girls Play?

A recent (2013) report produced by USTA Serves, “More than a Sport: Tennis, Education, and Health” promotes the merits of sports, specifically tennis. It identified the participation rates for the top nine community-based sports programs by race/ethnicity.

Overall basketball and volleyball are the top sports for adolescent girls.

The highest percentage of Blacks participated in basketball, track and field, and volleyball while the highest percentage of Hispanics played soccer, basketball, and volleyball. The top sports for Whites were basketball, volleyball, and baseball/softball.

As expected, team sports were more popular than individual sports.

As with the boys, the data shows that Whites, Blacks, and Hispanics prefer different sports. As communities are able to offer a greater variety of programs, more adolescents are able to benefit from participation in sports.

Sadly, a higher percentage of girls did not participate compared to the boys. Almost one-third of Hispanics and Blacks did not play in sports programs compared to one-in-five for Whites.

For Information about the participation rates for boys go to “What Sports do Adolescent Boys Play?

For additional information contact USTA Serves.


What Sports do Adolescent Boys Play?

USTA Serves, recently released the report “More than a Sport: Tennis, Education, and Health” to sell the positive benefits of tennis. It identified the participation rates for the top nine community-based sports programs and the participation rate of adolescent boys by race/ethnicity.

Football and basketball are the top sports for Whites, Blacks, and Hispanics. The highest percentage of Blacks participated in basketball, football, and track and field, while the most popular sports for Hispanics were football, soccer, and basketball. The top three sports for Whites were football, basketball, and baseball.

As expected, participation in team sports was greater than individual sports.

Interestingly, 16% of Whites did not participate in sports and only 12% of Blacks did not participate. About 15% of the Hispanic adolescents did not participate in sports programs.

The data shows that Whites, Blacks, and Hispanics prefer different sports. As communities expand their variety of sports programs, more adolescents are able to benefit from participation in sports.

For a comparison to the girls go to the blog post What Sports do Adolescent Girls Play?

For additional information contact USTA Serves.


USTA Study Shows Sports Participation Rates Favor Traditional Team Sports

Back in the day… the boys’ sports with the highest level of participation were football, basketball, baseball, track and field and wrestling. In many communities, these were the only programs.

The limited programs for girls included volleyball, basketball, softball, and track and field. The combination of Title IX and the expansion of recreation and sports facilities and programs created more opportunities for youth to participate in.

A recent (2013) report produced by the USTA, “More than a Sport: Tennis, Education, and Health” identified the participation rates for the top nine community-based sports programs.  The report shows the “traditional” sports still have the highest level of participation and the remainder of the list is filled out by a mix of team and individual sports. Over the past 30 years, soccer has become a major sport

For the boys, the participation rate and sport were:
40% Football
40% Basketball
25% Baseball
20% Soccer
17% Track and Field
10% Wrestling
9% Swimming
8% Tennis
5% Cross Country
Only 15% of the boys did not participate in a sport.

For the girls, the participation rate and sport were:
25% Basketball
23% Volleyball
17% Baseball/Softball
17% Soccer
17% Track and Field
12% Swimming
8% Tennis
4% Cross Country
3% Lacrosse
Unfortunately, 25% of the girls did not participate in sports programs.

The good news is that a high percentage of youth are participating in sports programs, particularly given the financial constraints put on schools, municipalities, and the private sector to offer such programs during the volatile economic times of the past decade.

USTA Serves, Inc. is the national charitable foundation of the USTA. For additional information contact the USTA, or go to Resources/Research tab on the USTA Serves website.


Placement of Athletics Link on the Home Page of PAC 12 Websites

Website layout is a challenging task, particularly at major research universities where many interests are vying for key real estate on the school’s home page. So where do you think the Athletics link is located on the home page for each of the PAC-12 universities? Is it located in the primary links or in a less conspicuous location?  Is there a difference in the location between the schools with winning football programs and those with losing records?  What is the name of the link to the athletics department?

The short study “Location of Athletic Link On PAC-12 Websites” shows there is a tendency for the PAC-12 schools with weaker football programs to place their Athletics link more prominently on their home page. Key findings from this analysis produced the following results:

  • The Athletics link for 7 of the 12 schools is not located in the primary links. Five of these 7 schools had winning records. These 7 schools had a combined 49-38 record.
  • The Athletics link for 5 of the 12 schools is located in the primary links. Three of these 5 schools had winning records. These 5 schools had a combined 32-32 record.
  • Stanford and Oregon had the best records. Neither school had their Athletics link in the primary links.

It was also interesting to note how the schools referred to their athletic programs.

  • Eight schools refer to their programs as Athletic Programs
    • Athletics and Recreation (Arizona)
    • Athletics (ASU, CU, OSU, UCLA, Utah, WSU)
    • Cal Athletics (California)
  • Four schools refer to their programs as Sports Programs
    • Sports (Oregon, Stanford, USC)
    • Husky Sports (Washington).

This brief study shows there is a difference in the location of the Athletics link on the home page. As well, schools refer to their programs in different ways (sports and athletics). It does not answer the following question, “Is the location of the Athletics link based on standard website layout principles or is it determined by the importance the university places on athletics relative to academics?”