Blog

American Men Have Weak Performance at Australian Open

Both the past director of USTA Player Development, Patrick McEnroe, and the current director, Martin Blackman, have spoken highly about the group of American junior boys who are transitioning into the professional ranks. Several of these youngsters took that step at the 2016 Australian Open. Their results showed they have potential, but it is clear they are the new kids on the block.

There were 14 American men in this year’s Grand Slam Down Under. The six first-round losers included newcomer Taylor Fritz and veterans Bjorn Frantangelo, Sam Querrey, Ryan Harrison, Brian Baker, and Donald Young.

Six of the eight remaining players were ousted in the second round with 1-1 records. Noah Rubin, the only youngster, was accompanied by the following players with more experience Denis Kudla, Austin Krajicek, Rajeev Ram, Tim Smyczek, and Jack Sock.

Journeyman Steve Johnson was ousted in the third round with a 2-1 tournament record.

John Isner, was defeated in the round of 16 with a 3-1 record. As is usually the case, he held his seed (#10). Overall the American men won 9 matches and lost 14.

Hats off to Novak Djokovic for capturing his sixth Australian tournament. He is now tied with Roy Emerson for the most number of Australian Open singles tournaments.

Historically, only a handful of Americans juniors have participated in the Australian Open. Only three American boys entered the junior event this year. Ezekiel Clark lost in the first round. Ulises Blanch exited in the second round (1-1) and Liam Caruana lost in the round of 16 (2-1).

Once again the Australian Open proved the current American men are capable of playing at the professional level, but they are no match for the world’s elite players. Time will tell if Fritz, Rubin, and their peers can hang with the best in the world.

Next stop French Open.
Women’s Australian Open 2016-Hats off to Serena

For the second consecutive Grand Slam Serena Williams was denied in the finals. This time Angelique Kerber delivered the knockout punch in a magnificent three-set match at the Australian Open. Williams loss begs the question, “Who will be the face of American tennis (not just women’s tennis) when Serena retires?”

Seventeen American women were entered in the first Grand Slam of 2016. Only eight advanced to the second round. The nine first-round losers included Alison Riske, Christina McHale, Sloane Stephens, Anna Tatishvili, Coco Vandeweghe, Samantha Crawford, Victoria Duval, Venus Williams, and Bethanie Mattek-Sands.

The three second-round losers included Irina Falconi, Nicole Gibbs, and Vania King. They were all 1-1.

Another three Americans lost in the third round including Varvara Lepchenko, Madison Brengle, and Lauren Davis. Each of these players had 2-1 records.

Madison Keys held her #15 seed by losing in the round of 16. She was 3-1 overall.

On a day-to-day basis, Williams continues to be untouchable, even though she won 6 of 7 matches and had to settle for the second place trophy.

So which of the American women is going to fill Serena’s shoes when she retires?

Martin Blackman began to address that question ten months when he was picked to head USTA player development. During his short tenure he has indicated that we need to produce more quality tennis players as a way of producing a few elite players.

While ten months isn’t time enough to turn a ship that sunk many months ago, the presence of the American juniors at the 2016 Open was abysmal. Maria Mataes was the lone competitor and was trounced 6-1, 6-1 in the first round of the Girls Junior event. Clearly the U.S. has a ways to go before there is quantity and quality.

While all of the American women athletes are outstanding players, only Madison Keys and Sloane Stephens have demonstrated they may have the potential to become  elite players. In the case of Stephens, her stock has fallen sharply over the past year.

Americans can only hope that Serena finds the fountain of youth. While there is reason to feel good about what if being said by Blackman and those in the USTA Player Development program, the future of American men’s and women’s professional tennis remains bleak.

Hats off to Serena Williams for another great performance!

Colorado Boys High School Tennis On Solid Footing

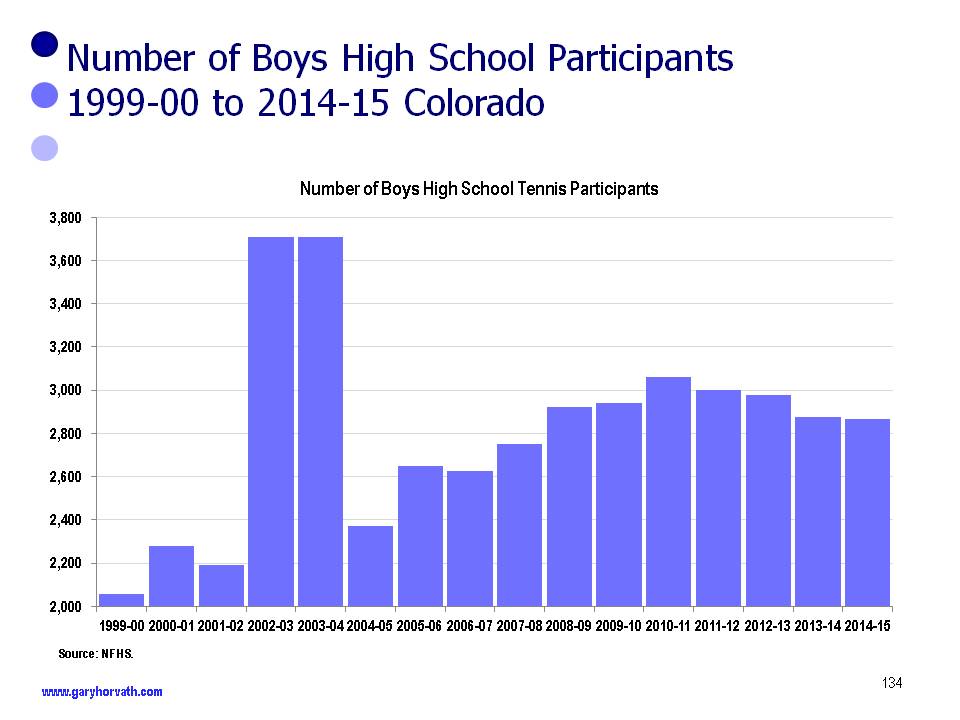
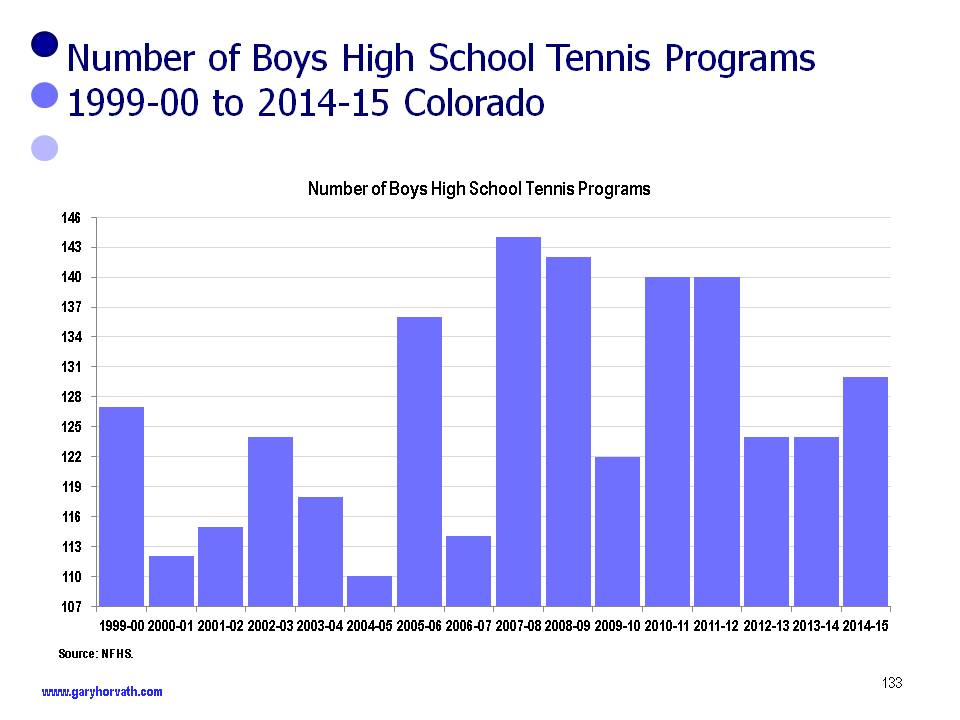
Between the 1999/2000 and 2014/2015 academic years the number of Colorado boys high school tennis programs ranged from 110 to 144, with the peak coming in 2007/2008. Since that time, there has been a decline in the number of programs. The range of the number of boys and girls programs was similar during these 15 years.

colorado boys high school tennis

For this period, there has been a wide range of participation in boys programs. Interestingly, the number of participants has a low level of correlations with the number of programs. At its peak, there were 3,707 participants, although that number appears to be an aberration. With the exception of this value, the number of participants ranged from 2,059 to 3,061. The number of participants has trended downward since 2010/2011. Over this period the annualized rate of growth in participation is 2.2%.

colorado boys high school tennis

Between 1999 and 2015 the Colorado population increased from 4.2 million to 5.4 million. This is a gain 1.2 million people, at an annualized rate of 1.7%.

The number of males between the ages of 15 and 19 increased from 156,330 to 185,377. This is a gain of 29,047 males, at an annualized rate of 1.1%.

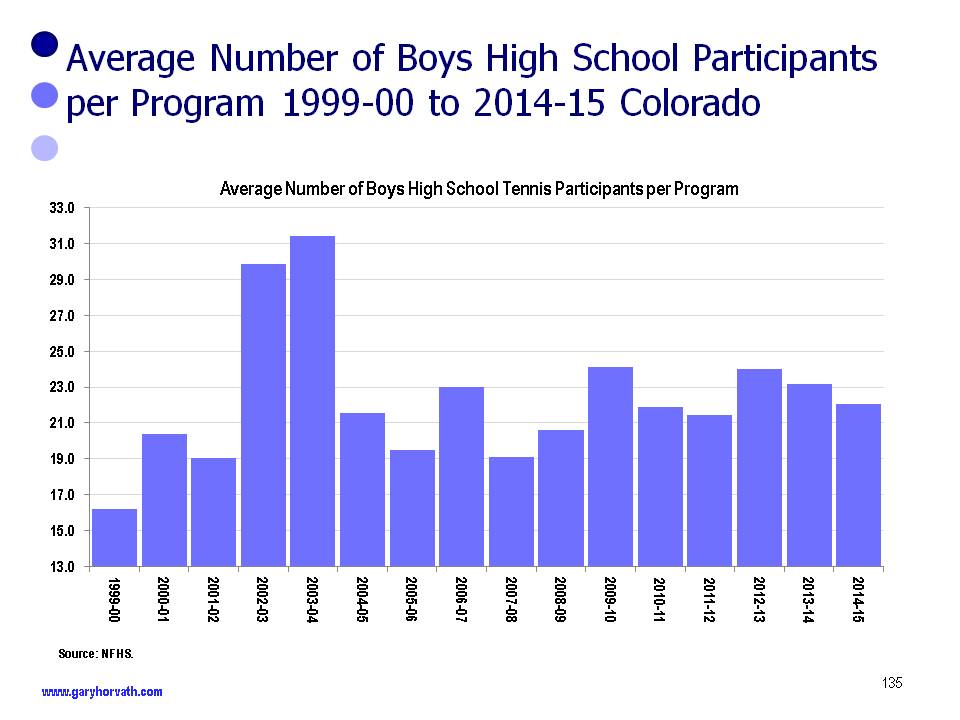
On average there were 23 participants per team over the past three years.

colorado boys high school tennis programs

There are a number of factors that are responsible for Colorado boys high school tennis not growing at a faster rate, including inadequate funding, facilities, and the lack of quality coaches. As well, U.S. tennis is growing at a long-term annualized rate less than the rate of growth in the U.S. population, (less than 1.0%). Probably the most important reason why the sport is not showing stronger growth is stiff competition from other fall sports. Football is the dominant fall sport, but cross country, soccer, golf and lacrosse are popular sports.

Overall, Colorado boys high school tennis is on solid footing, despite recent challenges.

Source: NFHS.

U.S. High School Girls Tennis Shows Modest Growth

This post summarizes participation in U.S. girls tennis programs based on data from the National Federation of State High School Associations (http://www.nfhs.org).

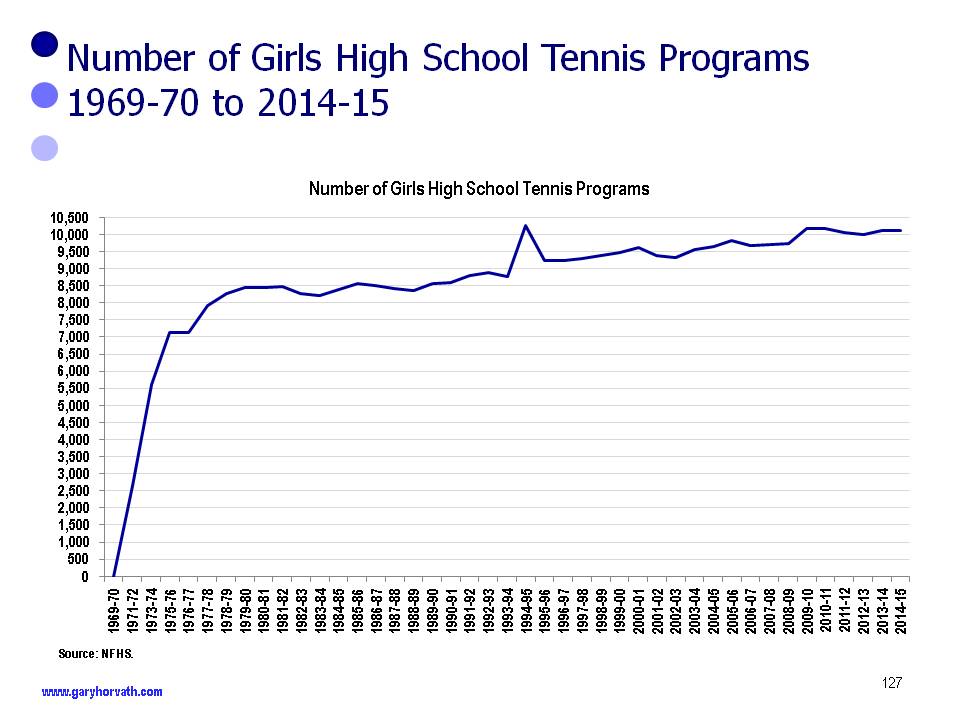
In 1969-70 there were no tennis high school programs in the United States. Participation in the sport exploded overnight when the President signed Title IX into law in 1972. Title IX prohibits discrimination on the basis of gender in any federally funded education program or activity. In addition, interest in the sport rose precipitously as a result of the Billie Jean King vs. Bobby Riggs match and the subsequent tennis boom. By 1979-80 there were 8,443 high school programs.

For the next decade the number of girls programs remained flat and there were 8,550 programs in 1989-90. Steady growth has occurred since that date. In 1994-95 the data shows there were 10,270 teams, although this number appears to be an anomaly or a glitch in the data.

In 2014-2015 there were 10,099 programs.

high school girls tennis

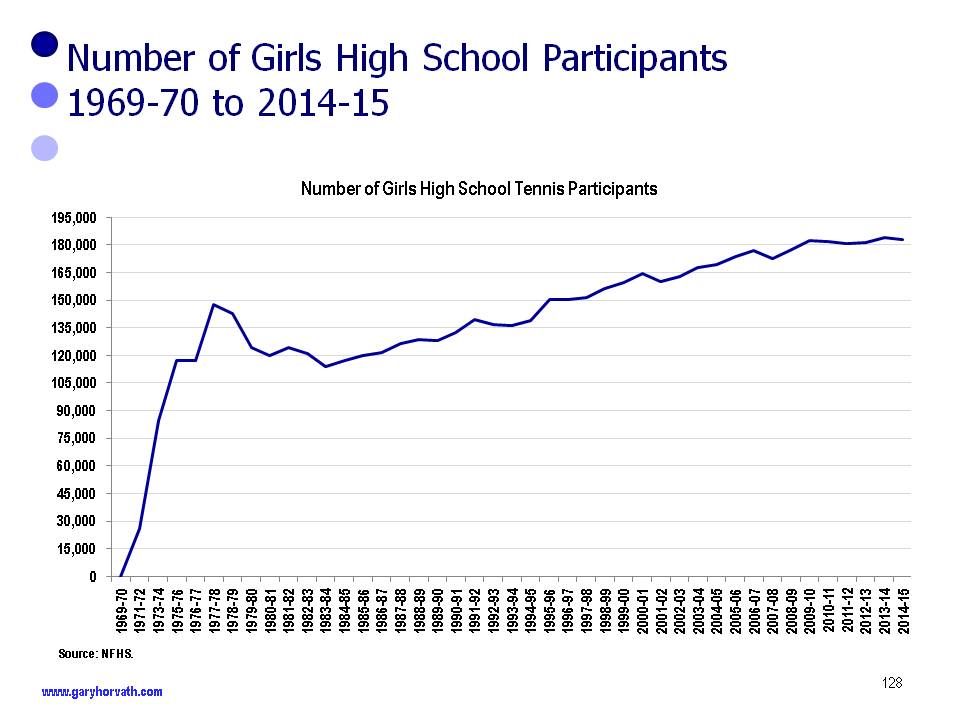
As might be expected, the trend for the number of participants is similar to the number of programs. In 1969-70 there were no participants. Between then and 1977-78 the number of participants the number of participants reached 147,365.

As a result of the bust in the tennis industry, participation plummeted to 114,177 in the 1983-84 season. From that point, the number or participants increased gradually to 182,395 in 2009-2010. It has remained flat since then.

In 2014-25 there were 182,876 participants.

high school girls tennis

Title IX is the primary reason for the growth of the sport. Other factors that have caused participation to rise and fall are the overall popularity of tennis and competition from other girls sports. Other factors impacting the number of participants are the size of school budgets, local feeder programs, and the number of qualified coaches in the school districts.

Between 1999-00 and 2014-15 the number of programs increased at an annualized rate of 0.43% while the number of participants rose by 0.91%.

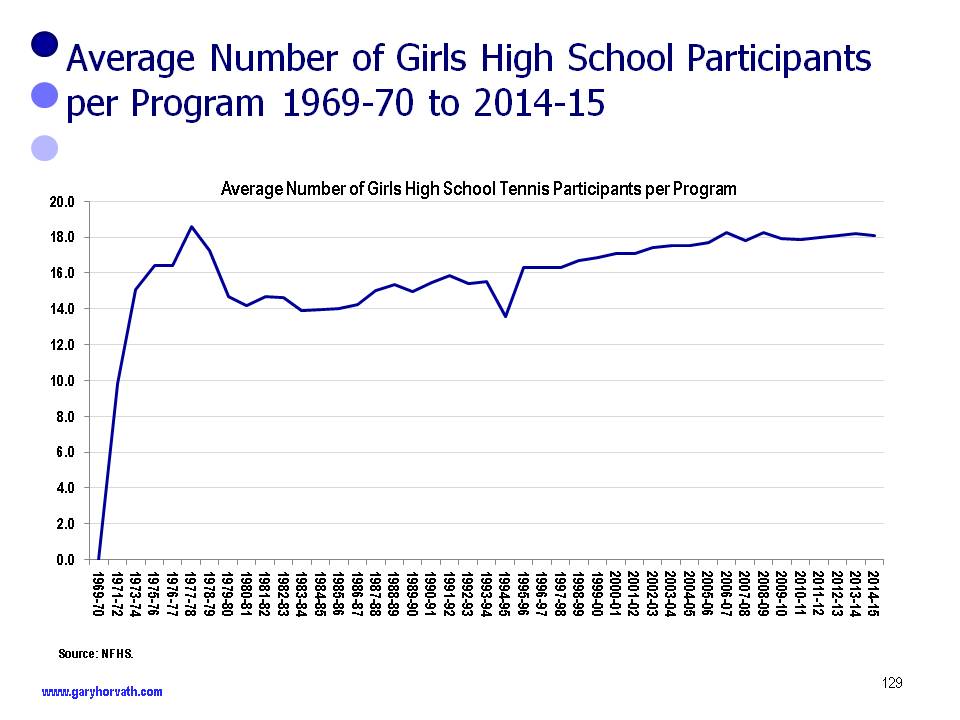
The average number of participants per program ranged from 13.6 to 18.6 players.

high school girls tennis

High school girls tennis is a small, but important part of the U.S. tennis population. The number of participants is likely to grow at a rate similar to the growth in the U.S. population.

U.S. High School Boys Tennis Shows Steady Growth

This post focuses on participation in U.S. high school boys tennis programs. It is based on data from the National Federation of State High School Associations (http://www.nfhs.org).

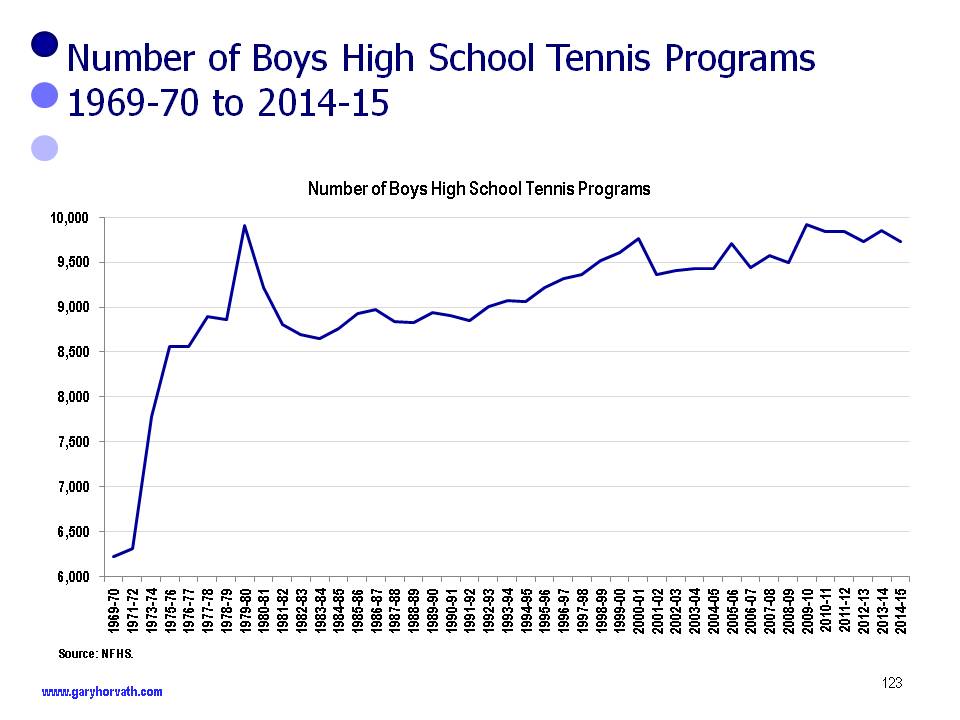
In 1969-70 there were 6,221 boys high school programs in the U.S. Interest in the sport rose precipitously as a result of the Billie Jean King vs. Bobby Riggs “Battle of the Sexes” match and the subsequent tennis boom. By 1979-80 there were 9,912 high school programs.

The tennis bust happened more quickly than the boom and that downturn was reflected in the data. By 1983-84 the number of boys programs had fallen to 8,644.

From that low point, the number of programs gradually increased. During the 2009-10 season there was a record number of boys teams – 9,916 teams. This was 4 more programs than the previous peak in 1979-1980.

In 2014-2015 there were 9,725 programs.

high school boys tennis

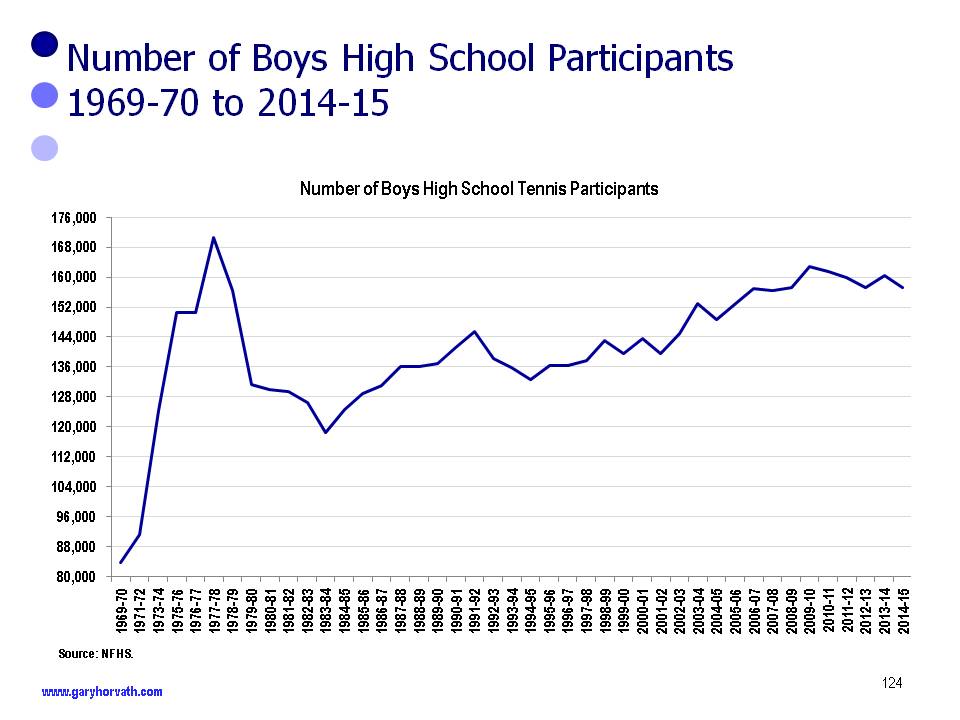
As might be expected, the trend for the number of participants is similar to the number of programs. In 1969-70 there were 83,717 participants. Between then and 1977-78 the number of participants more than doubled to a peak of 170,653 participants.

By the 1983-84 season, participation had plummeted to 118,539. From that point, the number increased gradually to 162,755 in 2009-2010.

In 2014-25 there were 157,240 participants.

high school boys tennis

Factors that have caused interest in the sport to rise and fall are the overall popularity of tennis and competition from other sports such as lacrosse and cross country. In some schools Title IX may have reduced court time for boys or caused schools to move boys tennis to a different season. Other factors impacting the number of participants are the size of school budgets, the number of local feeder programs, and the number of qualified coaches in the school districts.

Between 1999-00 and 2014-15 the number of programs increased at an annualized rate of 0.08% while the number of participants rose by 0.8%.

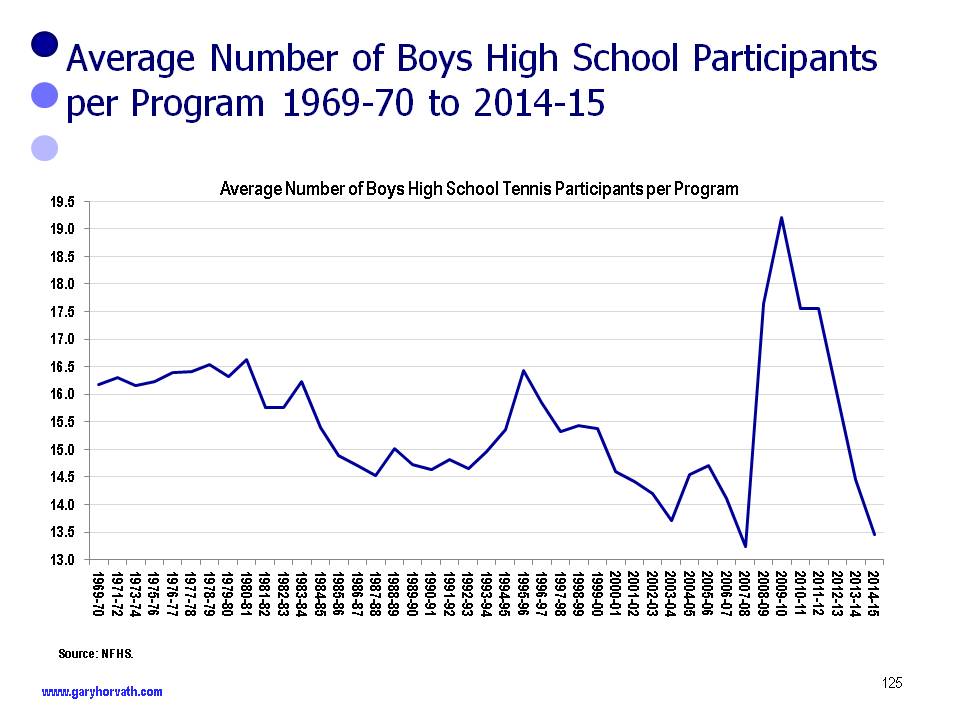
The average number of participants per program ranged from 13.5 to 19.2 players.

high school boys tennis

High school boys tennis is a small, but important part of the U.S. tennis scene. The number of participants is likely to grow at a rate similar to or slightly less than the growth in the U.S. population.

Value of Recreation Facilities to a Community

Recreation facilities may add direct economic value or indirect benefits to a community. This post will focus on the latter realizing that city leaders may be focused on their direct economic value.

The term “recreation facilities” may include sports fields, gymnasiums or indoor facilities, parks, or open space. Recreation facilities may impact a community in the following ways:
• Recreation facilities can serve as a gathering spot for locals of all ages. This in turn will increase pride in the area and make the community more cohesive.
• They can be a tool for economic development that helps with the retention and attraction of businesses and talented individuals.
• Parks and facilities may serve as a tourist attraction. The ski areas in Colorado are a prime example. The impact of visitors to these facilities could be measured by their spending at hotels, restaurants, gasoline stations, and retail stores.
• Tournaments, special activities, or ongoing programs may attract visitors from outside the local area.
• A strong recreation facility may benefit local retailers who sell sporting goods equipment.
• Recreation facilities may also drive the formation of spinoff recreation businesses that complement programs at the facility.
• Special events or activities may draw media coverage for the facility and the community. For example, Farmington, New Mexico claims to be the amateur baseball capital because it has hosted Connie Mack and Babe Ruth tournaments since 1965.
• Recreation facilities with active programs increase the health of the local community. Boulder, Colorado is considered a recreation Mecca and one of the healthiest cities in the country.
• Some recreation facilities have staff who publish periodic health and fitness press releases in the local media to promote a healthy and active community.
• Studies have shown that quality recreation facilities increase the value of neighboring property. For example, homes surrounding a golf course may have greater property value than those several blocks away.
• Strong recreation facilities and programs keep residents in the area who might otherwise travel outside the community for goods and services. In turn, this reduces sales leakage to neighboring communities.
• Direct facility use, which includes providing activities for adolescents, will keep them active and may reduce the chances of them getting in trouble.
• Facilities that are part of a complex that includes parks and/or open space may mitigate air pollution. Some complexes are designed to assist with storm water retention or to address other environmental issues.
• Public recreation facilities often provide reasonably priced access to recreation facilities because they are supported by tax dollars.
Quite often these factors are more important to community leaders than the profit or loss of operating a recreation facility.

Many of the above factors were identified in the reports, The Economic Benefits of Denver’s Park and Recreation System by the Trust for Public Land and Measuring the Economic Impact of Park and Recreation Services, by John L. Crompton.

recreation facilities
Recreation facilities can add value to a community in many ways.


PAC-12, Smack 12 – Best Volleyball Conference?

PAC-12, Smack 12 – for a number of years, smack talkers from the West have claimed the PAC-12 is the top collegiate volleyball conference in the country. At times that has been true; however, that wasn’t the case in 2015.

Without a doubt the Big 10 was the country’s elite collegiate volleyball conference this season. The following table shows the win-loss records for the NCAA teams from the Big 10.

Team Record
Nebraska 6-0
Minnesota 4-1
Illinois 2-1
Ohio State 2-1
Penn State 2-1
Wisconsin 2-1
Michigan State 1-1
Michigan State 1-1
Purdue 1-1

Not only did the tournament champion come from the Big 10, but six of the conference teams had winning records and all of the Big 10 teams won matches.

The Huskers won six matches – three were 3-0 and three were 3-1. Their dominance was impressive given the depth of the field.

Looking ahead to next season, you have to feel sorry for the Big 10. The leading hitter for Nebraska was Kadie Rolfzen (412 kills) and right behind her was Mikaela Roecke (386 attacks). Rolfzen is a junior and Roecke is a freshman.

Amber Rolfzen led the team in blocks (182) and Kelly Hunter led the team in assists (1,501). Rolfzen is a junior and Hunter is a sophomore. The chances are pretty good that Nebraska will have a “decent” team in 2016.

Sixty four teams played in the NCAA championships. These teams represented thirty-two conferences.

The following 20 teams and conferences were at the bottom with 0-1 records.

University Conference
• SMU American Athletic Conference
• New Hampshire American East Conference
• Lipscomb Atlantic Sun Conference
• NAU Big Sky
• Coastal Carolina Big South Conference
• UNC Wilmington Colonial Conference
• Cleveland State Horizon League
• Fairfield Metro Atlantic
• Ohio Mid-American Conference
• Howard Mid-Eastern Athletic Conference
• Colorado State Mountain West
• Robert Morris Northeast Conference
• Belmont Ohio Valley Conference
• Furman Southern Conference
• Texas A&M Corpus Christi Southland Conference
• Jackson State Southwestern Athletic Conference
• Arkansas State Sun Belt
• Harvard The Ivy League
• Denver The Summit League
• NMSU WAC

In addition, the PAC-12 and Missouri Valley Conference were leaders for the number of teams with first round losses. Both had three, followed by the Big 12 with two. The ACC, SEC, WCC, and Big East also had teams that bowed out in the first round.

Only 12 conferences had teams that won matches and only six conferences had winning records.

Conference Record
Big 10 21-8
Big 12 10-5
PAC-12 9-7
SEC 5-4
WCC 5-4
Big West 3-1
Big East 3-3
ACC 3-4
Atlantic 10 Conference 1-1
Conference USA 1-1
Patriot League 1-1
MVC 1-4

Only 16 of the 64 teams had winning records

University Conference Record
Nebraska Big 10 6-0
Texas Big 12 5-1
Minnesota Big 10 4-1
Kansas Big 12 4-1
Hawaii Big West 3-1
USC PAC-12 3-1
Washington PAC-12 3-1
Florida SEC 3-1
Illinois Big 10 2-1
Ohio State Big 10 2-1
Penn State Big 10 2-1
Wisconsin Big 10 2-1
Creighton Big East 2-1
UCLA PAC-12 2-1
BYU WCC 2-1
Loyola Marymount WCC 2-1

While it is entertaining to play with the data and talk smack about which conference is best, the most impressive aspect of the 2015 NCAA Championships was the number of quality players on all teams.

Congrats to the Cornhuskers and Big 10 on a great season!

Lady Buffs Volleyball Wins and Attendance Peaked in 2014

The CU Lady Buffs volleyball team peaked in 2014.

There was a small group of players who raised their level of play in 2015. Unfortunately, their efforts were not enough to carry the Lady Buffs volleyball team to the NCAAs. To add insult to injury, the average size of the crowds in 2015 was less than during the previous season.

CU Lady Buffs Volleyball
Setter Nicole Edelman led the CU Lady Buffs Volleyball team to two NCAA tournaments during her career.

The University of Colorado became a member of the PAC-12 Conference in 2010 and began competition in 2011. During their first two seasons the Lady Buffs volleyball team was the doormat for the league; however they won slightly more than half their conference matches for the 2013 – 2015 seasons.

The Lady Buffs won only 1 of 22 conference matches in their first season. On a positive note, they won their only conference match at home. Since the first year, there has been steady improvement on the court and in the stands. The Lady Buffs were:
• 1-21 in 2011.
• 4-16 in 2012.
• 9-11 in 2013.
• 11-9 in 2014.
• 11-9 in 2015.
In five PAC-12 seasons they have had three losing conference seasons and were selected for two NCAA appearances. They won 36 conference matches and lost 66. The Lady Buffs reach a plateau in 2014.

Their home court conference record also got better. The Lady Buffs were:
• 1-10 in 2011.
• 4-6 in 2012.
• 7-3 in 2013.
• 6-4 in 2014.
• 7-3 in 2015.
The Lady Buffs have won 25 home matches and lost 26 in five seasons. On the road they were 11-40.

Finally, their average attendance at conference home games showed steady gains until 2015. Attendance at the Lady Buff home matches was:
• 814 in 2011.
• 1,226 in 2012.
• 1,169 in 2013.
• 1,452 in 2014.
• 1,395 in 2015.
With the exception of the Oregon match, more than 1,000 players were in attendance at all home matches. Unfortunately there were no matches where the Buffs had more than 2,000 fans in attendance.

Lady Buffs Volleyball Home Conference Attendance 2015

Date Opponent Score Attendance
9-Oct USC 2-3 1,899
11-Oct UCLA 0-3 1,972
16-Oct California 3-1 1,432
18-Oct Stanford 3-1 1,809
30-Oct Oregon State 3-2 1,116
31-Oct Oregon 2-3 948
12-Nov Arizona State 3-2 1,672
14-Nov Arizona 3-0 1,029
25-Nov Washington State 3-2 1,055
27-Nov Utah 3-1 1,021

Best wishes to Coach Mahoney and the Lady Buffs volleyball program for a productive offseason and for continued improvement in 2016. The program deserves better support than it has seen in the past.

Change, Ugh!

This post is an excerpt from the paper, “Your Mission Should you Choose to Accept it is to be a Coach“. The paper was written to encourage volleyball coaches to incorporate relevant training into their practices. For some this means making changes.

Many people struggle when they are asked to change. Coaches may agree that the concept of relevant training makes sense, but implementing change may be easier said than done. The following two discussions are included to let coaches know they are not alone if they wrestle with change. Endorsing change will allow coaches to further increase learning, improvement, and fulfillment in their practices.

First Discussion
Parent: Did you like the part of the USAV IMPACT course where they talked about how the game teaches the game.
Coach: Yeah, that’s a cool idea. I like it.
Parent: Can you implement it into your practices?
Coach: Oh we can’t do that because we have to teach the girls how to hit the ball and where to stand. We have to teach the girls and don’t have time to play games.

Second Discussion
Parent: Could the coaches in your club be more effective if the players had more meaningful touches in practice?
Coach: Yes, most of our coaches aren’t very good at doing that and don’t get it. Would you watch my practice and give me some feedback?

After practice…

Parent: You have great rapport with your athletes and they have fun. Do you think they will retain what you worked on?
Coach: Yes, we did my favorite blocking drill for 35 minutes, they better get it, or else.
Parent: I noticed several players standing around and others did not appear to be engaged. Did you see the same thing?
Coach: Oh that is normal.
Parent: Would it help to change drills?
Coach: No, one girl doesn’t like to block, the other one was injured and couldn’t go 100%, and the other girl has had a bad attitude since day one. They just need to focus.

Another more light-hearted approach to accepting change is to imagine that David Letterman was a volleyball coach who didn’t like change. The following are 10 reasons he might give for not integrating relevant training into his practices.

If David Letterman was a Volleyball Coach who Didn’t Want to Change…
1. I have a set of great drills that were handed down to me from my coach and his coach.
2. The club has a system that works. Why change?
3. I like single focus drills because I’m in control. They look more organized, That’s important to the parents.
4. I don’t like to have multiple balls in the air because that makes practice look chaotic and unsafe.
5. It is important to demonstrate to the players and parents that I am knowledgeable about the sport by giving detailed descriptions of skills, techniques, and tactics. The kids need to learn to listen and focus. That is how they learn.
6. When I told the parents that the game teaches the game, they said, “That’s why we play tournaments. Get on the court and teach them how to play!”
7. If the club really wanted me to be a better coach they could pay for me to go to coaching clinics – in Hawaii.
8. I like breaking the skill into parts, because I can explain it better to the players that way.
9. It’s just the junior varsity team. The kids aren’t very good, so it doesn’t matter if we hire someone who has never coached before.
10. When the girls miss their serves, they should run 3 laps. It’s good conditioning and it motivates them. That’s how you teach discipline and skills.

If this sounds like your son or daughter’s coach, it is time to start shopping for a new program.

Lady Buffs Volleyball Staying Home this Postseason

On Sunday, the NCAA announced the field for their 2015 women’s volleyball championships. The field of 64 included 32 automatic berths for conference championships and an equal number of at-large slots.

The Big 10 has bragging rights for the most number of teams (10) followed by 7 PAC-12 teams and 5 Big 12 teams. The top seeds were: No. 1 University of Southern California, No. 2 University of Minnesota, No. 3 University of Texas, and No. 4 University of Nebraska.

The announcement of the field took an unexpected turn for Colorado Buffs fans. The hometown team finished fifth in the PAC-12 with an 11-9 conference record and a 19-13 overall record. Despite their showing, the Lady Buffs were not invited to attend the Big Dance – yet invitations were extended to the 6th place Ducks (10-10 in conference and 16-13 overall), 7th place Wildcats (9-11 in conference and 19-13 overall) and 8th Sun Devils (8-12 in conference and 19-12 overall).

Here’s the way the conference season unfolded for CU:
• On a positive note, the Buffs swept Arizona, California, and Oregon State.
• The Buffs split matches with Arizona State, Oregon, Stanford, and Utah.
• The Buffs lost one match to Washington and defeated Washington State in one match.
• The Buffs were swept by USC and UCLA

The Buffs played 6 matches with a score of 3-2.
• They defeated Arizona State, Oregon, Oregon State, and Washington State.
• They lost to Oregon and USC.

In pre-conference play, the Buffs were 8-4. They were swept by Penn State (8th at the end of the season) and Illinois (21st at the end of the season). They dropped a 3-1 match at home to San Diego, who received votes in the final rankings. The Buffs other loss came at the hands of Rice, 3-1.

On a positive note, the Buffs had a 3-2 win over Florida State (ranked 19th at the end of the season). The other wins were against teams they shouldn’t have been playing:
• Oklahoma 12-16
• Sam Houston State, 14-18
• Louisiana-Lafayette, 6-23
• Montana State, 3-21
• Weber State, 6-22
• George Mason, 10-19
• Air Force, 12-21.
Combined these 7 teams were 63-140; they won 31.0% of their matches.

The Buffs had “good wins” against Stanford and FSU and at the end of the season they received votes for the top 25. A strong case can be made that the Lady Buffs were a legitimate top 32 team, i.e. they should have been invited to the Big Dance.

A strong case can be made that the Lady Buffs were a legitimate top 32 team, i.e. they should have been in the Big Dance.

If you consider the non-conference “bad losses” to Rice and San Diego and the conference losses to Oregon, Utah, and Arizona State, a strong case can be made that the Lady Buffs should stay at home.

The moral of the story is that competition against good teams and consistency matter!

Lady Buffs Sweep California
Lady Buffs sweep California.