Blog

CU Buffs Football Attendance Up in 2015

The hard cold facts about college football are that every Saturday half the teams are losers. And the CU Buffs are doing their best to make their opponents feel good about themselves on the weekends.

Over the past decade the abysmal win-loss record of the CU Buffs football team has given fans a reason to find other things to do on Saturday afternoons than support the black and gold.

The problems began over a decade ago. The Buffs finished the 2004 and 2005 seasons with 7-5 records. In 2004 they were 4-4 in the Big 12 and in 2005 they were 5-3. Oklahoma beat them 42-3 in the 2004 Big 12 Championships and Texas thumped them 70-3 the following year.

Many viewed these drubbings in the championships as a sign that CU was not capable of participating in the D1 football race to see which program could spend the most money. The CU administration viewed the losses differently. They used them as justification for hiring a new coach.

In retrospect, those days of getting slaughtered in the Big 12 championships were the good old days. The Buffs football team has not had a winning season since 2005.

In 2011, dollar signs flashed in front of the CU administrators and CU jumped from the Big 12 to the PAC-12 conference. Unfortunately the Buffs found out the PAC-12 also had teams that knew how to play football.

Since 2011, the Buffs have had five conference wins – three on the road and two at home. Details follow:

Year Conference Record Comments
2011 2-7 conference record Home win over Arizona and a road win against Utah.
2012 1-8 conference record Road win over Washington State.
2013 1-8 conference record Home win over California.
2014 0-9 conference record Ugh!
2015 1-8 conference record 17-13 squeaker in Corvallis

Unfortunately, the Buffs conference home attendance has paralleled the number of wins on the field.

2011
The Buffs were 1-4 at home in conference play.
• 9/10 49,532 California
• 10/1 51,928 Washington State
• 10/22 52,123 Oregon
• 11/4 50,083 Southern California
• 11/22 48,111 Arizona.
Average conference home attendance 50,355.

2012
The Buffs were 0-5 at home in conference play.
• 9/29 46,893 UCLA
• 10/11 45,161 Arizona State
• 10/27 44,138 Stanford
• 11/17 43,148 Washington
• 11/23 46,052 Utah.
Average conference home attendance 45,078.

2013
The Buffs were 1-3 at home in conference play.
• 10/5 45,944 Oregon
• 10/26 38,679 Arizona
• 11/16 38,252 California
• 11/23 36,005 Southern California.
Average conference home attendance 39,720.

2014
The Buffs were 0-5 at home in conference play.
• 9/13 38,547 Arizona State
• 10/04 36,415 Oregon State
• 10/24 37,442 UCLA
• 11/1 35,633 Washington
• 11/29 39,155 Utah
Fewer than 40,000 people attended every home game and average conference home attendance was 37,438.

2015
The Buffs were 0-5 at home in conference play.
10/3 46,222 Oregon
10/17 39,666 Arizona
10/31 51,508 UCLA
11/13 37,905 USC
11/28 45,823 Utah
The downward trend in attendance has been reversed. Average home attendance for the 2015 home conference games was 42,225 and Buffs fans were usually treated to a good show. Even though they were 0-5, they lost the five home games by a total of only 37 points.

Buff fans have to be the most loyal in the country. Despite going 2-22 at home since joining the PAC-12, they still keep showing up. Here’s to a better 2016! The CU Athletic Department needs fans in the seats to provide better funding for the Olympic sports.
Buffs Waiting for a Bowl Berth?

On November 16th the Daily Camera sports department ran an article titled, “Buffs Clinging to Dim Hope for a Bowl Berth.” Excerpts from the article follow.

A whopping 80 bowl game spots are available this year. Of the 128 teams in the FBS, 62 teams have already earned bowl eligibility, while 34 have no chance of getting to the magic number of six wins.

Among the other 32 teams, 18 are just a win away from the six-win mark.

That leaves 14 other long shots that haven’t had good seasons to this point, yet still cling to hope.

Colorado is among the 14.

CU’s hope, however, stems from the fact that there might actually be a shortage of bowl eligible teams this season. If that’s the case, a 6-7 CU team could slip in through the back door and go bowling.

With all due respect to the players, coaches, and program – the Buffs don’t deserve a bid to a bowl. The team made progress this season, but they are a losing program that finds new and exciting ways to continuing being a losing program. It is actually sad.

At this point in the season the Buffs are 4-7. They started off the season 3-1, with wins over Massachusetts (2-8), CSU (5-5), Nicholls State (2-8), and Oregon State (2-8). Combined these four teams have won only 11 games while losing 29. Ouch!

The story gets worse.
• Massachusetts had wins over Eastern Michigan (1-9) and FIU (5-6) – total 6-15.
• CSU beat Savannah State (1-8), University of Texas San Antonio (2-8), Air Force (7-3), Wyoming (1-9), and UNLV (3-7) – total 14-39.
• Nicholls State beat Lamar (5-5) and Houston Baptist (2-8) – total 7-13.
• Oregon State beat Weber State (5-5) and San Jose State (4-6) – total 9-11.
These four schools won 11 games. Only one of their opponents had a winning season (CSU beat Air Force). The combined record of these programs was 36-78.

In other words, CU was only able to beat teams that were capable of defeating only really weak programs.

This season will cap off a decade of losing seasons, although things were only slightly better in 2005 when they were 7-6. In the past nine seasons the Buffs were 31-79.

Here’s to a better season in 2016. The athletic program need a winning football team to generate more revenue to provide greater support for the minor sports.

Weak Volleyball Coaches or Too Many Programs – North Metro

There is concern among volleyball parents in the North Metro/Northern Colorado area (north or I-70) that the overall quality of the club and high school volleyball programs is  weaker than other parts of the Front Range.

Discussions with club directors and high school coaches say there are plenty of good coaches, but there are too many programs. That means there aren’t enough good players for all the programs. They also point out that the sport is growing and there is greater depth. That means there is more equity among the teams.

Let’s take a look at how the North Metro/Northern Colorado teams did in the regional and state tournament.

In the CHSAA 5A regional playoffs the Northern teams were represented by 9 teams and they were 6-12 in match play. Sadly, only Fairview advanced to state.

Region School Record in Regionals
3 Fossil Ridge 1-1
4 Loveland 1-1
5 Poudre 0-2
6 Brighton 0-2
6 Legacy 0-2
7 RockyMountain 1-1
8 Fort Collins 0-2
9 Boulder 0-2
11 Fairview 1-1
Total Northern 5A 6-12

Fairview represented the North Metro area/Northern Colorado well by finishing second at state. They were 3-2  in the tournament. They won 9 sets and lost eight and they won 50.3% of the points played (384-379).

The following table shows that Northern 4A teams had a strong showing in the regional championships. Nine of the 36 teams in the regional competition were from the northern region and 6 of the teams qualified for state. The northern 4A teams were 16-7 in match play.

Region School Record in Regionals
1 Weld Central 0-2
4 Holy Family 2-0
4 Niwot 1-1
6 Longmont 2-0
7 Windsor 2-0
8 Erie 1-2
8 Silver Creek 3-1
11 Berthoud 2-0
12 Mead 3-1
Total Northern 4A 16-7

Note: Erie, Silver Creek, and Mead had playoffs in their pool play. Silver Creek and Mead advanced to state.

On the first day of the state tournament, the 4A teams played 7 matches and were 0-7. They did not even win a set. Silver Creek was the only North Metro/Northern Colorado team to win a set against a team from outside that region when they lost 3-1 to Delta.  Overall, the teams from the Northern area were 2-10, with the only wins coming against teams from the region.

School Matches W-L Sets W-L Points W-L % Points Won
Holy Family 0-2 0-6 97-150 29.3%
Longmont 1-1 3-3 136-141 49.1%
Windsor 1-1 3-4 132-147 47.3%
Silver Creek 0-2 1-6 123-169 42.1%
Berthoud 0-2 0-6 113-150 43.0%
Mead 0-2 1-6 117-172 40.5%
Total – Northern 4A 2-10 9-36 718-929 43.6%

There are a number of strong players in the North Metro/Northern Colorado region. However, with the exception of Fairview they were not competitive with the top teams in the state. Is the weak performance from the North a function of a shortage of strong coaches and club programs (as some parents claim) or is it a result of too many programs and not enough good players on a team (as the club directors suggest)? Good question.

Top Sports in Colorado for High School Girls

What were the top sports for high school girl athletes in Colorado in 2014?

Data from the National Federal of State High School Athletic Associations (NFHS), https://www.nfhs.org/, shows that the top sports for girls, from an athletic director’s perspective, are basketball, volleyball, track and field, cross-country, and soccer. More than 300 Colorado schools have basketball, volleyball, and track and field programs and greater than 200 schools have cross-country, and soccer programs.

At the bottom of the list are field hockey and alpine and cross-country ski programs.

Sport Number of Schools with Programs
Basketball 329
Volleyball 318
Track and Field — Outdoor 302
Cross Country 230
Soccer 213
Competitive Spirit Squad 190
Softball — Fast Pitch 178
Golf 164
Tennis 153
Swimming & Diving 153
Lacrosse 81
Gymnastics 66
Skiing — Alpine 14
Skiing — Cross Country 14
Field Hockey 13

Top Sports in Colorado - Volleyball

From the athlete’s perspective the ranking is much different. Volleyball is overwhelmingly the most popular sport followed by soccer, track and field, basketball, and tennis.

Alpine and cross-country ski programs are clearly at the bottom.

Sport Number of Participants
Volleyball 9,097
Soccer 7,623
Track and Field — Outdoor 7,334
Basketball 7,089
Competitive Spirit Squad 4,810
Tennis 4,552
Swimming & Diving 4,142
Cross Country 3,957
Softball — Fast Pitch 3,724
Lacrosse 1,604
Golf 1,514
Field Hockey 592
Gymnastics 543
Skiing — Alpine 151
Skiing — Cross Country 100

The data showed there are 175 girls participating in boy’s wrestling, baseball, football (11,8, and 6 player), and Ice hockey. There were 85 in wrestling and 42 in baseball.

Football, Basketball, and Track – Top Sports in Colorado

What were the top sports in Colorado for boys in high school during the 2014 season?

Data from the National Federal of State High School Athletic Associations (NFHS), https://www.nfhs.org/, shows that the most popular sports, from an athletic director’s perspective, for boys are basketball, track and field, baseball, wrestling, and cross-country, and soccer. More than 300 Colorado schools have basketball programs. While just under 300 have track and field and baseball. If all levels of football (6,  8, and 11 player) are combined, then football is the third most popular sport.

Sport Number of Schools with Programs
Basketball 330
Track and Field — Outdoor 299
Baseball 279
Wrestling 240
Cross Country 230
Football — 11-Player 211
Soccer 211
Golf 189
Tennis 130
Swimming & Diving 118
Lacrosse 113
Ice Hockey 64
Football — 8-player 49
Football — 6-player 35
Skiing — Alpine 14
Skiing — Cross Country 14

At the bottom of the list are alpine and cross-country ski programs.

From the athlete’s perspective the ranking is much different. Despite concerns about concussions, football is overwhelmingly the most popular sport. It is followed by track and field, basketball, baseball, and soccer.  At that point there is a significant drop to wrestling, cross-country, and lacrosse.

Sport Number of Participants
Football — 11-Player 14,917
Track and Field — Outdoor 9,597
Basketball 8,764
Baseball 8,248
Soccer 7,770
Wrestling 4,978
Cross Country 4,068
Lacrosse 3,787
Tennis 2,868
Golf 2,145
Swimming & Diving 2,066
Football — 8-player 859
Ice Hockey 644
Football — 6-player 453
Competitive Spirit Squad 172
Skiing — Alpine 140
Skiing — Cross Country 117

Competitive spirit squad and alpine and cross-country ski programs are clearly at the bottom.

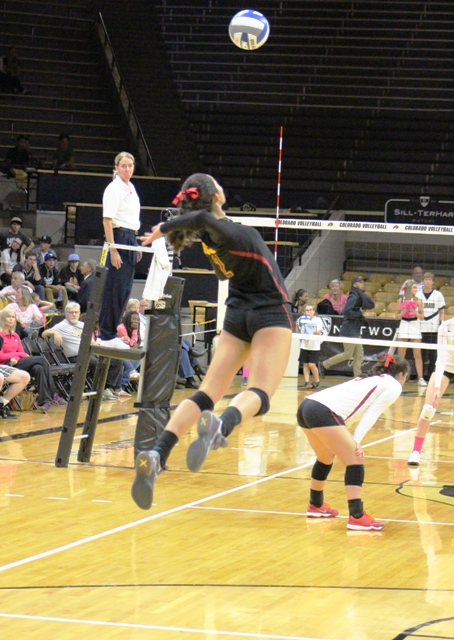
USC’s Samantha Bricio Does it All

The following three tweets are from the University of Southern California women’s volleyball twitter account in their 3-1 victory over Oregon State University on October 23rd (25-20, 24-26, 25-16, 25-18). They provide valuable lessons for junior volleyball players.

There was a day when players were stereotyped – tall girls hit and blocked and short girls dug and set. Today all the players, no matter their height, have to do it all.

The first two tweets are about Samantha Bricio, a 6’2″ senior Outside Hitter from Guadalajara, Mexico.

Lesson 1: Bricio does it all!

USC W. Volleyball ‏@uscwomensvolley 8h8 hours ago
@samybricio finishes with 23K (.246) and 15 digs for her 10th double-double of the season. She also had two aces and three blocks #FightOn

Lesson 2: Bricio actually got her double-double just prior to the end of the second set. Bricio has been a consistent well-rounded player for a number of years.

USC W. Volleyball ‏@uscwomensvolley 9h9 hours ago
With 15K and 10D, @samybricio already has her 10th double-double of the season (50th career) through two sets#FightOn #vbscores

Lesson 3: When you are number one in the country, how do you lose a set 24-26 when you have 23 kills and a block? Guess you have to hit your serve in….oops!? (USC missed 5 serves in the second set.) You lose matches when you have unforced errors.

USC W. Volleyball ‏@uscwomensvolley 9h9 hours ago
USC hit .373 in set two and scored all 24 of its points (23K, 1B) but had five service errors | S2 Tied 1-1 #FightOn #vbscores.

bricio

Lady Buff Nuria Ormeño Ruiz Qualifies for NIIC

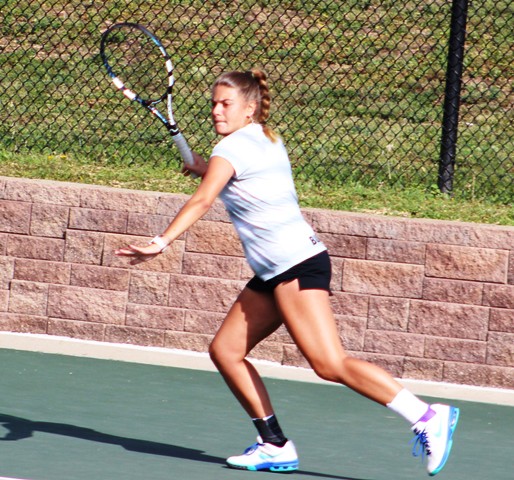
University of Colorado junior Nuria Ormeño Ruiz won the USTA/ITA Mountain Region Championship on Sunday (October 18). She is the first Lady Buff to capture the regional singles title.

After losing the first set, Ormeño Ruiz rebounded to defeat the University of Denver’s Julia O’Loughlin by a score of 4-6, 6-4, 6-3. The cubuffs.com website reported that the match began outdoors and was moved inside for the final set because of inclement weather.

With the win, Ormeño Ruiz automatically qualified for the USTA National Indoor Intercollegiate Championships in New York City on Nov. 12-15. This marks the first time the Buffs have had a singles player competing in the NIIC.  Last season Julyette Steur and Kyra Wojcik were the first Lady Buffs doubles team to qualify for the tournament.

Ormeño Ruiz was born in Madrid, Spain and graduated from the Emilio Sanchez International School in Barcelona. The cubuffs.com website indicates she entered the fall season with 38 singles and 25 doubles career victories as a Lady Buff.

The Lady Buffs have had a strong fall season and will begin the spring season on January 17 in Boulder against Air Force. Make plans now to support the Lady Buffs during their PAC-12 play.

Nuria Ormeño Ruiz

Assess Your Mindset to Increase Relevant Training

Coaches can increase the level of relevant training in their practices with an honest self-evaluation of their mindset. The following questions can be used in such an evaluation.

  • Do the coaches have a growth mindset as opposed to a fixed mindset?
  • Do they create an environment where athletes are challenged to learn?
  • Do the coaches focus on effort or performance as opposed to outcome?
  • Do the coaches provide constructive feedback or feed-forward comments?
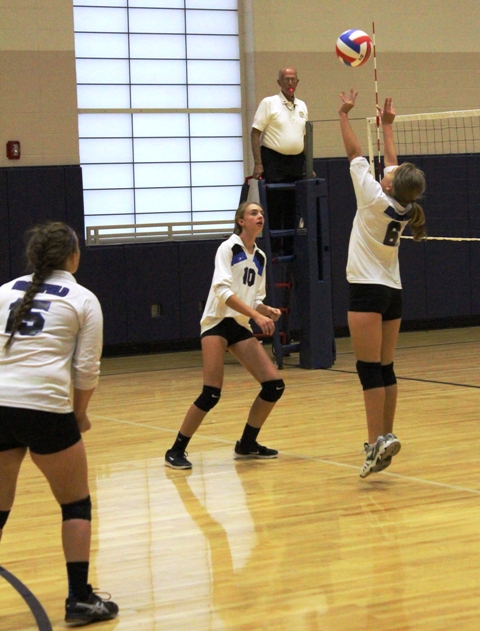
  • Do they use cues that are meaningful to players to help them learn?  In the photo below the setters coach was at court side and used cues to effectively communicate with the setter between points.relevant training
  • Do the practice activities transfer to match play or do they emphasize false fundamentals or skills that make the players look good in practice?
  • Do the coaches understand that players have peaks and valleys and over time their performance regresses to their mean performance?
  • Do coaches focus on raising the mean performance of athletes rather than emphasize the peaks and the valleys?
  • Is the coach committed to relevant training and meeting the needs of the athletes?

Most coaches will find that after they have answered these questions they are excellent in some areas and can improve in other areas. Changes can be made as appropriate.

Assess Your Practices to Increase Relevant Training

Volleyball coaches can increase the level of relevant training in their practices with an honest self-evaluation or assessment from another coach. The following  questions can be used in such an evaluation.

  • Do you have a practice plan? Do you post it or share it with the athletes?
  • Do the drills in your practice plan address the needs of your athletes?
  • Have you established the time to be allocated for each drill? For example, some coaches will plan for 4 to 5 drills in an hour (12 to 15 minutes per drill). This allows them time for a 20 to 30 minute scrimmage.
  • Do your coaches have the same expectations of the players in practice and matches? For example, are the players told to serve aggressively in practice then told to just get it in when they play matches?
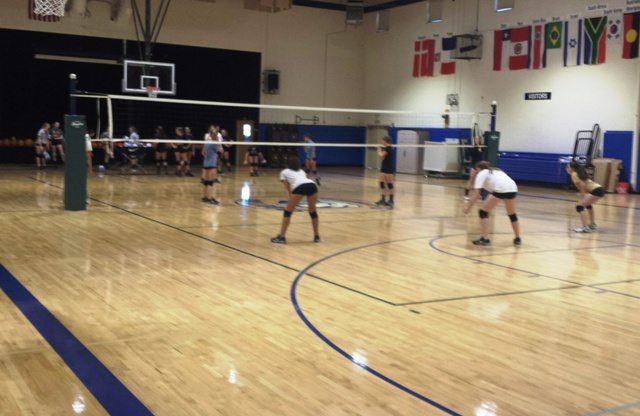
  • Do your drills maximize use of the space in the gym?  For example, in the practice shown in the photo below, the coaches had 18 players. By setting up the gym differently they would have played on two courts and better met the needs of the athletes.relevant training
  • Have you optimized touches while allowing for necessary discussions, drill changes, and water breaks? Coaches can practice conveying a message in 30 to 60 seconds or the length of a time they have to talk during a time out.
  • Do you have names for your drills? This eliminates the need to describe them every practice.
  • Have you incorporated the mindset of kids teaching kids into your practice? Juniors learn good and bad things by watching their peers play. They also learn when they are asked to teach their peers to play.
  • Have you taught the athletes to feed or toss the ball to start drills? Feeding is a physical activity that it better than standing and watching. When athletes are initiating the drill it allows the coaches to be in a position to help the athletes.
  • Do you practice what happens in a match? For example, do you your setter practice setting when the pass is out of system?
  • Have you included scoring systems in your drills to make them competitive or game-like?
  • Do you have a backup plan when drills go really well or horribly?
  • At what point should you make a drill tougher or easier? A general guideline is to make the drill more difficult If the players’ success rate is 65% to 70% or higher and make it easier if the success rate is lower.
  • How many drills include multiple balls in the air at the same time?
  • Do you keep your practice plans and make notes of what worked and how your players performed?

Most coaches will find that after they have answered these questions they are excellent in some areas and can improve in other areas. Changes can be made as appropriate.

Playing Time – Why is My Daughter Sitting on the Bench?

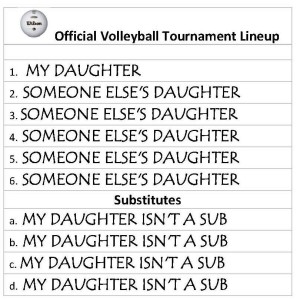
If you asked parents what they are paying for when they put their children in a volleyball program many would say they are paying for playing time in the tournaments.

Instead of focusing on playing time in matches, parents should have the following discussion with club and school coaches, “Court time is a precious commodity. Use it wisely. When is the team going to have more relevant training so my daughter will get more meaningful touches and game-like learning? What are you doing to make her a gamer, not just a star in practice? ”

It is understandable that parents want to see their daughter compete in match play given their time and financial investment in the sport. At the same time, they need to do the following math problem to understand the relationship between playing time and practice time.

Playing time

Does your daughter spend more time playing or practicing?

Assumptions

A. A club practices 3 times a week for 2 hours each practice for 24 weeks.
B. The club plays 5 matches at 6 tournaments during the season. They also play 5 matches in 2 national qualifier tournaments. Each match lasts 1 hour.

Calculations

A. The total hours spent in practice are 3 X 2 X 24 = 144 hours.
B. The total hours spent playing matches equals 5 X 6 X 1 = 30 hours plus 2X5=10; 30 +10=40.

Answer

Your daughter spends 40 hours in practice and 144 hours playing matches.

Coaches must be fair in allocating playing time. More importantly, they have an obligation to make practices more relevant by increasing the number of meaningful touches and game-like activity.