Stanford and California Atop ITA 2016 Women’s Rankings

The May 25th season-ending Intercollegiate Tennis Association (ITA) women’s team rankings (http://www.itatennis.com/) saw Stanford and California at the top of the polls. Both schools are from the PAC-12.

The SEC conference had three top ten teams – Florida, Vanderbilt, and Georgia. The ACC also had two teams in the top 10, North Carolina and Miami.

Six of the top 10 teams moved up in the rankings compared to the January 5th rankings, two remained in the same position, and two teams fell in the rankings but remained in the top 10.

By the end of the season, USC, Virginia, UCLA, and Texas A&M had fallen out of the top 10 rankings (January 5th).

May 25, 2016 Ranking January 5, 2016 ranking School Conference
1 8 Stanford PAC-12
2 6 California PAC-12
3 3 University of Florida SEC
4 tie-4 North Carolina ACC
5 1 Vanderbilt University SEC
6 18 Ohio State University Big 10
7 tie-4 University of Georgia SEC
8 12 Oklahoma State University Big 12
9 19 Pepperdine WCC
10 13 University of Miami (Florida) ACC

As expected there was minimal movement in the singles rankings between January 5th and June 1st, with a couple of exceptions.

June 1, 2016 ranking January 5, 2016 Ranking Player School Conference
1 4 Danielle Collins Virginia ACC
2 6 Hayley Carter North Carolina ACC
3 14 Luisa Stefani Pepperdine WCC
4 2 Francesca Di Lorenzo Ohio State Big 10
5 12 Ellen Perez University of Georgia SEC
6 7 Sinead Lohan University of Miami (Florida) ACC
7 16 Breaunna Addison Texas Big 12
8 11 Brooke Austin Florida ACC
9 5 Maegan Manasse California PAC-12
10 9 Stephanie Wagner University of Miami (Florida) ACC

The following players fell out of the top 10 rankings over the course of the season:
• In the January 5th poll, Joana Eidukonyte, Clemson, was ranked first; she finished the season in the 30th position.
• Belinda Woolcock of Florida was ranked 3rd on January 5th, but fell to 15th by the end of the season.
• Julia Elbaba, Virginia, was ranked 8th at the start of the season and dropped to 13th.
• Finally Klara Fabikova, California, began the season ranked 10th and finished in the 16th position.

The ACC dominated the top 10 singles rankings with 5 players. Miami had two players ranked in the top 10.

The results of this year’s team and individual tournaments were interesting in the sense that the number one team in the country Stanford only had one singles player ranked in the top 25. Carol Zhao was ranked 24th.

Having strong depth is much different than having the top players in the country. Some teams have depth, some have strong players, and a few have both. That is what makes college tennis so exciting.
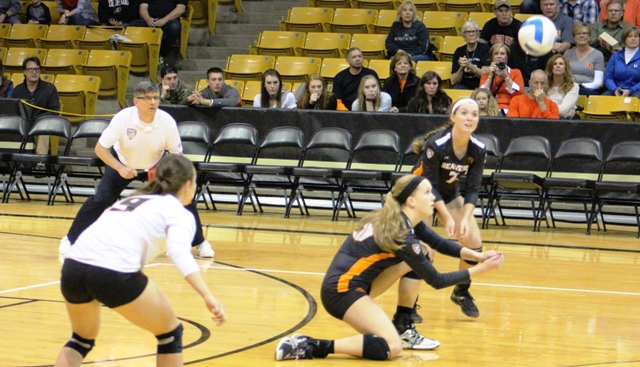
Lady Buffs Volleyball Staying Home this Postseason

On Sunday, the NCAA announced the field for their 2015 women’s volleyball championships. The field of 64 included 32 automatic berths for conference championships and an equal number of at-large slots.

The Big 10 has bragging rights for the most number of teams (10) followed by 7 PAC-12 teams and 5 Big 12 teams. The top seeds were: No. 1 University of Southern California, No. 2 University of Minnesota, No. 3 University of Texas, and No. 4 University of Nebraska.

The announcement of the field took an unexpected turn for Colorado Buffs fans. The hometown team finished fifth in the PAC-12 with an 11-9 conference record and a 19-13 overall record. Despite their showing, the Lady Buffs were not invited to attend the Big Dance – yet invitations were extended to the 6th place Ducks (10-10 in conference and 16-13 overall), 7th place Wildcats (9-11 in conference and 19-13 overall) and 8th Sun Devils (8-12 in conference and 19-12 overall).

Here’s the way the conference season unfolded for CU:
• On a positive note, the Buffs swept Arizona, California, and Oregon State.
• The Buffs split matches with Arizona State, Oregon, Stanford, and Utah.
• The Buffs lost one match to Washington and defeated Washington State in one match.
• The Buffs were swept by USC and UCLA

The Buffs played 6 matches with a score of 3-2.
• They defeated Arizona State, Oregon, Oregon State, and Washington State.
• They lost to Oregon and USC.

In pre-conference play, the Buffs were 8-4. They were swept by Penn State (8th at the end of the season) and Illinois (21st at the end of the season). They dropped a 3-1 match at home to San Diego, who received votes in the final rankings. The Buffs other loss came at the hands of Rice, 3-1.

On a positive note, the Buffs had a 3-2 win over Florida State (ranked 19th at the end of the season). The other wins were against teams they shouldn’t have been playing:
• Oklahoma 12-16
• Sam Houston State, 14-18
• Louisiana-Lafayette, 6-23
• Montana State, 3-21
• Weber State, 6-22
• George Mason, 10-19
• Air Force, 12-21.
Combined these 7 teams were 63-140; they won 31.0% of their matches.

The Buffs had “good wins” against Stanford and FSU and at the end of the season they received votes for the top 25. A strong case can be made that the Lady Buffs were a legitimate top 32 team, i.e. they should have been invited to the Big Dance.

A strong case can be made that the Lady Buffs were a legitimate top 32 team, i.e. they should have been in the Big Dance.

If you consider the non-conference “bad losses” to Rice and San Diego and the conference losses to Oregon, Utah, and Arizona State, a strong case can be made that the Lady Buffs should stay at home.

The moral of the story is that competition against good teams and consistency matter!

Lady Buffs Sweep California
Lady Buffs sweep California.


The Height of Women PAC-12 Volleyball Players in the 2014-15 Season

An analysis was conducted of the women’s PAC-12 volleyball programs to identify the height of players by teams and positions. Coaches and players can use this information to set realistic and attainable team and individual performance goals. As a result it coaches will be able to better manage their player’s expectations when they are competing for college scholarships.

Women’s college volleyball is a great sport for players of all heights; however, it favors women who are taller than average. Key findings from this analysis show that:
• The range of height is 63 inches to 80 inches.
• The average height for all players is 71.6 inches.
• For many reasons, there is not a correlation between average team height and won-lost record.
• The top teams in the conference had fewer players who played half the sets (9 or 10 players vs. 11 or 12).
• Slightly more than 50% of the players are between 72 inches and 75 inches.

The breakdown of the 120 players by position category was:
• DS/L 32 players 26.7%.
• Setters 18 players 15.0%.
• Middles 27 players 22.5%.
• OH 43 players 35.8%.
Competition is stiffest for setters.

The average height and range by position category was:
• DS/L 67.1 inches 63 to 72 inches.
• Setters 70.2 inches 66 to 72 inches.
• Middles 74.5 inches 73 to 80 inches.
• OH 73.8 inches 71 to 80 inches.
These tendencies can be oversimplified as follows:
• Players under six feet tall are setters or DS/Liberos.
• Players who are at least six feet tall are middles or outsides.
Because players grow at different rates, they must learn to adapt as they get older. For example, the tallest 13-year old may be the middle for the 13U team. If her teammates outgrow her then four years later it may be appropriate for her to become the libero for the 17U team.

For more details about the height of the women’s PAC-12 volleyball players click here.

PAC-12 Volleyball Mary-Kate Marshall
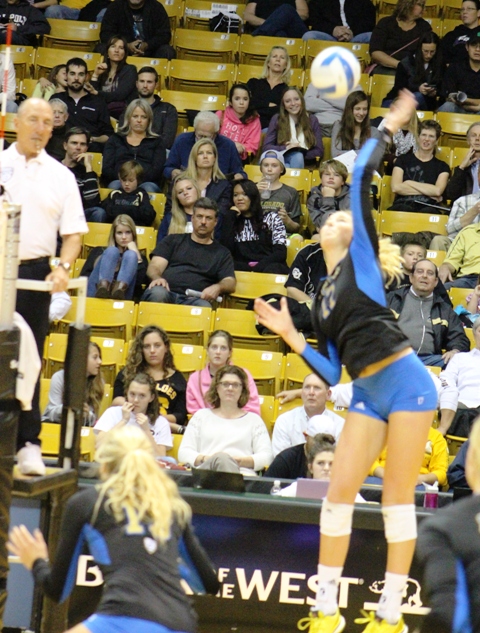
OSU star hitter Mary-Kate Marshall receiving serve against the CU Buffs.

Where Do PAC-12 Volleyball Players Reside?

Are you a junior volleyball player thinking about playing on your favorite PAC-12 volleyball team?

If so, you have to be good – really good!

The following stats from the 2014-2015 season may help you understand your chances of playing in one of the country’s elite volleyball conference:
• There were 120 players who played more than half the sets. In other words, the coaches generally had rotations of 9 or 10 players and occasionally 11 or 12 players.
• The PAC-12 is a regional conference. Almost 3-in-4 of the players were from the 6 states where PAC-12 universities were located.
• About 43% of the players on all teams were from California. Each of the teams had at least 2 Californians. It seems there is a mandate that coaches and recruiters  live and breathe the words of the infamous Beach Boys tune, “I Wish they All Could be California Girls.”
• The more successful teams had a higher percentage of out-of-state players. As well, they had a greater percentage of California players. In other words, the top teams more effectively attracted the top players from in-state and other states.
• Unlike some other sports, only about 8% of total players are from foreign countries. It is ironic that American players have to play professional ball overseas; however, overseas athletes don’t dominate U.S. college volleyball.

Specifically, the PAC-12 players reside in the following states:
• 52 players were from California.
• 9 Players were from Arizona.
• 8 Players were from Oregon.
• 7 Players were from Utah.
• 7 players were from Texas.
• 6 players were from Colorado (3 of the players were sisters who played on the same team).
• 5 players were from Washington.
• 4 players were from Hawaii.
• 12 players were from 9 other states.

PAC-12 Volleyball is clearly the conference of choice – both for players and coaches. Unfortunately, only a handful players make the cut. Hopefully, you are one of them!

PAC-12 Volleyball Karsta Lowe
Karsta Lowe attacks against the CU Buffs in PAC-12 volleyball play.

Big Ten and Pac-12 Dominate NCAA Volleyball Championships

Once again the women’s  NCAA Volleyball Championships were a showdown between the Big Ten and the Pac-12. The Big Ten captured bragging rights for quality with six teams entered and three of the eight quarterfinalists. The Pac-12 laid claim to the deepest conference, with ten teams entered and one semifinalist.

On December 4th, 64 teams from 31 conferences kicked off regional play for the 34th NCAA women’s volleyball tournament. On December 20th, Penn State won the championship for the second consecutive year.

Each of the six Big Ten representatives won matches. The overall conference record was 17 wins and 5 losses.

Big Ten Won Lost
Penn State 6 0
Wisconsin 3 1
Nebraska 3 1
Ohio State 2 1
Illinois 2 1
Michigan St. 1 1
Conference Total 17 5

Each of the ten Pac 12 teams won matches. Conferences teams were 17-10 in championships.

Pac 12 Won Lost
Stanford 4 1
Oregon 2 1
Oregon State 2 1
UCLA 2 1
Washington 2 1
Arizona 1 1
Arizona State 1 1
Colorado 1 1
USC 1 1
Utah 1 1
Conference Total 17 10

The 16 teams from the Big Ten and Pac-12 conferences won 34 of the 63 matches played in the championships. That is dominance!

Five teams represented the SEC. Florida had three wins and was the only SEC team that had a strong presence in the championships. Texas @&M was the only team that did not win a match.

SEC Won Lost
Florida 3 1
Alabama 1 1
Kentucky 1 1
LSU 1 1
Texas A&M 0 1
Conference Total 6 5

Four teams represented the ACC. North Carolina and Florida posted winning records.

ACC Won Lost
North Carolina 3 1
Florida 2 1
Miami (FL) 1 1
Duke 0 1
Conference Total 6 4

Four teams represented the West Coast Conference. The strongest WCC team was finalist BYU. The Cougars were the only team from the conference to win matches.

WCC Won Lost
BYU 5 1
Loyola Marymount 0 1
San Diego 0 1
Santa Clara 0 1
Conference Total 5 4

With the exception of Texas, the Big 12 was represented by teams that were weak by Big 12 standards.

Big 12 Won Lost
Texas 4 1
Iowa State 1 1
Kansas 0 1
Kansas State 0 1
Oklahoma 0 1
Conference Total 5 5

Combined, the 19 teams from the SEC, ACC, WCC, and Big 12 won 22 matches of the 63 matches played.

There were 5 conferences that had the remaining 7 wins in the championships. CSU was the only team to have two wins.

School and Conference Won Lost
Colorado State Mountain West 2 1
Hawaii Big West 1 1
Long Beach State Big West 1 1
Dayton Atlantic 10 1 1
UALR Sunbelt 1 1
Illinois State Missouri Valley 1 1
Total 7 6

In total, the 41 teams that represented the 11 conferences mentioned above had a combined record of 63-39.

Of the 41 teams representing the 11 conferences mentioned above only 9 teams did not win a match. In addition, there were 24 teams from 20 conferences represented that did not win a match.

Generally speaking, these teams were admitted to the tournament as a courtesy because they were conference champions. While these teams and conferences all have solid programs, they are not competitive with the top teams or conferences. This is evident by the first round match scores for the losers. The majority of first round losers lost their only match 3-0. The summary of first round match scores follows:

  • 23 matches, 71.9%, were 3-0.
  • 5 matches, 15.6%, were 3-1.
  • 4 matches, 12.5%, were 3-2.

For the 31 other matches played (second round through the finals) the  majority of the scores were 3-1, i.e. the matches were more competitive. A summary of these scores follows:

  • 12 matches, 38.7%, were 3-0.
  • 14 matches, 45.2%, were 3-1.
  • 5 matches, 16.15%, were 3-2.

It is clear from the results that there are multiple tiers of ability within the NCAA Division I teams. The good news is that these 64 programs offer athletic opportunities for 600-700 of the country’s top women volleyball players.

Congratulations to Penn State on another NCAA volleyball championship!

Colorado Lady Buffs Volleyball Ranked 21st

Congratulations to the Colorado Lady Buffs volleyball team and the PAC-12 on their 2014 season. Setter Nicole Edelman and AVCA All-American hitter Taylor Simpson led the Lady Buffs to a year-end ranking of 21st in the country. Nine PAC-12 teams were ranked in the top 25.

Lady Buffs Volleyball
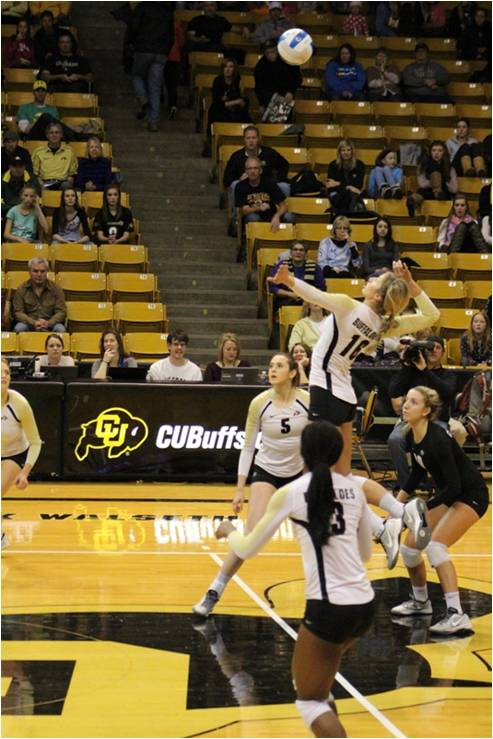
Nicole Edelman (5) has set Taylor Simpson (16).

Best wishes to the Lady Buffs for a productive off-season and strong recruiting to fill the voids left by the graduating seniors.

2014 Season Ending AVCA Rankings (PAC-12 Teams in Blue)

Rank School Total Points Adjusted 2014 Record Previous Rank
1 Penn State 1500 36-3 4
2 Stanford 1432 33-2 1
3 BYU 1374 30-5 12
4 Wisconsin 1306 31-3 2
5 Texas 1276 27-3 6
6 Florida 1183 28-4 5
7 North Carolina 1115 29-3 7
8 Nebraska 1074 23-10 11
9 Washington 1049 31-3 3
10 Florida State 921 30-3 8
11 Illinois 900 26-8 10
12 Colorado State 853 31-3 9
13 Ohio State 744 23-12 18
14 Oregon 681 23-10 16
15 UCLA 659 22-12 17
16 Arizona 613 24-10 14
17 Kentucky 497 27-6 13
18 Utah 443 20-13 20
19 Long Beach State 407 27-5 15
20 Oregon State 376 20-13 NR
21 Colorado 333 20-14 19
22 Arizona State 231 20-14 22
23 Hawai'i 204 22-7 23
24 Arkansas-Little Rock 96 30-5 NR
25 Duke 74 22-8 21


Lady Buffs Volleyball Attendance on the Rise

The University of Colorado became a member of the PAC-12 Conference in 2010 and began competition in 2011. After tough seasons in their first two years, the Lady Buffs volleyball team won half their matches in 2013 and 2014.

The Lady Buffs won only 1 of 22 conference matches in their first season. On a positive note, they won their only conference match at home. Since the first year, there has been steady improvement on the court and in the stands.

On the court their Pac-12 record has improved over time. The Lady Buffs were:
• 1-21 in 2011.
• 4-16 in 2012.
• 9-11 in 2013.
• 11-9 in 2014.
In 4 years they have had 3 losing seasons and won 25 conference matches and lost 57.

Their home court conference record also got better. The Lady Buffs were:
• 1-10 in 2011.
• 4-6 in 2012.
• 7-3 in 2013.
• 6-4 in 2014.
The Lady Buffs have won 18 home matches and lost 23 in four seasons. On the road they were 7-34.

Finally, their average attendance at conference home games has shown steady gains. Attendance at the Lady Buff home matches was:
• 814 in 2011.
• 1,226 in 2012.
• 1,169 in 2013.
• 1,452 in 2014.

The reported average attendance during the 2014 season was noticeably greater than 2013. With the exception of the first match, more than 1,000 players were in attendance at all home matches.  They have a ways to go to catch up with Washington and other top teams, but at least they are headed in the right direction.

Lady Buffs Volleyball Home Conference Attendance 2014

Date Opponent Score Attendance
25-Sep Utah 3-2 462
3-Oct Arizona State 2-3 1 185
5-Oct Arizona 3-1 1 112
17-Oct Stanford 2-3 2 846
19-Oct California 3-1 2 035
6-Nov UCLA 0-3 1 280
9-Nov USC 0-3 1 672
13-Nov Washington 3-2 1 029
16-Nov Washington State 3-2 1 239
26-Nov Oregon State 3-1 1 655

Best wishes to the Lady Buffs volleyball team for a productive offseason and for continued improvement in 2015.

mary kate marshall Lady Buffs Volleyball
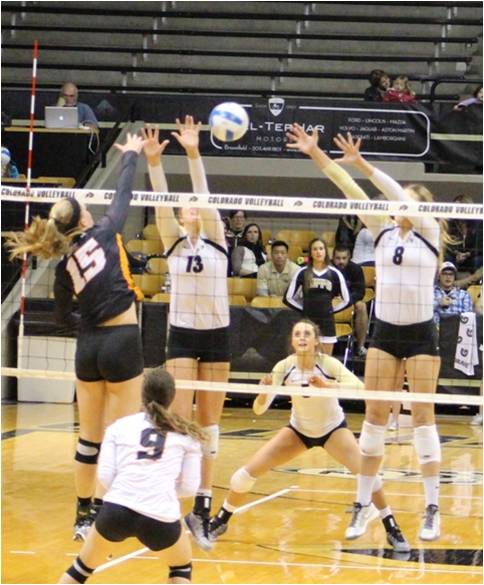
Mary Kate Marshall hits through a double block by the Lady Buffs volleyball team.


Talk of Bowl Game for CU Buffs

Brian Howell, Sports Writer for the Daily Camera is a homer (and there is nothing wrong with that.)  On August 23 he wrote an editorial entitled, “Talk of bowl game for CU Buffs has merit this season.”

Howell began the article with the following comments:
“During fall camp this month, a handful of media members stood just outside of the practice fields and discussed the possibilities for the 2014 Colorado football team.
‘Am I crazy to think this team could get to a bowl game?’ one of them asked.
No, believe it or not, it’s not crazy.”
Later he added “Without question, this team is going to need some good fortune along the way to reach bowl eligibility, but no, it’s not crazy to think they can get there.”

Howell thought it was possible the Buffs could sweep the non-conference slate. He was correct until they played the CSU Rams in the season opener. Oops! Thank goodness the Buffs found a way to sneak past Hawaii and UMass. Both Buff opponents are 2-7 at this point in the season.

Later in his article Howell stated, “And, don’t think the Buffs are going to be happy with showing progress by turning blowout losses into narrow losses.”

Howell indicated possible conference wins might come against the following teams:
• California – Buffs lost 59-56 in OT
• Arizona State – Buffs lost 38-24.
• Oregon State – Buffs lost 36-31
• The Buffs will play Arizona on November 8th and Utah on November 29th.
With today’s loss to Washington, the Buffs bubble burst and they dropped to 2-7.With a little luck they will end the year 4-7. Most likely it will be 3-8 or 2-9.

The good news is the Buffs were stronger and they had greater entertainment value this season. From an academic perspective the Buffs will also have an opportunity to focus on their studies this December, while other teams have to focus on winning bowl games. And to top it off, they are blessed with a local sports writer is aDoormat - Bowl Game for CU Buffs homer (and there is nothing wrong with that).

On the downside, there are no moral victories when you play football in the big time. The Buffs are still the doormats of the PAC-12 and ticket sales have reportedly continued on a downward path. Thank goodness CU is playing in the PAC-12. Things would be even worse if they were in one of the top two conferences, the SEC, or the Big 12.

As is the case with the Chicago Cubs, there is always next season.

Residence of PAC 12 Men and Women Basketball Players

This brief analysis evaluated rosters of men’s and women’s PAC-12 basketball teams to determine what states or countries their players reside in. It looked at information published on their athletic websites in March 2014. Players were included in the sample if their average playing time per game for the season was greater than 15 minutes.

The results for the men are in the table below.

Residence of Men PAC-12 Basketball Players
Residence of Men Basketball Players

The results for the women are in the table below.

Residence of Women PAC-12 Basketball Players

Listed below are similarities and differences between the men’s and women’s programs.

Similarities

  • A majority of the players on most teams are from out-of-state.
  • The reliance on foreign players is minimal; the percentage of foreign players is 15.1% for the men vs. 8.0% for the women.
  • The state with the highest number of players is California.
  • The foreign country with the highest number of players in Canada.
  • The programs with a higher percentage of in-state players are more successful (this is not necessarily a cause and effect relationship).
  • The men’s programs had seven teams with winning records and the women’s programs had six teams. Three of the four winning programs are California teams, although the California teams are different for men and women.
  • The schools from states with smaller populations typically have fewer in-state players and are less successful.

Differences

  • The percentage of in-state players is greater for women than men, 36.4% vs. 23.3%.
  • The percentage of out-of-state U.S. players is greater for men than women, 61.5% vs. 55.7%.
  • The men players are from more states than the women, 21 vs. 16.
  • The reliance on California players is greater among women than men, 39 women vs. 30 men.
  • Female programs have more players from Texas and Washington than the men.
  • The percentage of out-of-state foreign players is greater for men 15.1% vs. 8.0% for women.
  • The men foreign players are from 7 countries compared to 3 countries.
  • Ten of the mens’ teams were competitive (won at least 8 games), whereas, only 7 of the womens’ teams were competitive.

For more details see the report PAC 12 Location of Residence for Basketball Programs. This report identifies the home state or country of the top PAC 12 basketball players and compares differences between the men and women teams.


Which States do PAC 12 Women’s Basketball Players Reside in?

This brief analysis evaluated rosters of women’s PAC-12 basketball teams to determine the residence of their players (in-state, out-of-state, or foreign country). It looked at information published on their athletic websites in March 2014. Players were included in the sample if their average playing time per game for the season was greater than 15 minutes.

The states with the leading number of players were California (39), Washington (11), Texas (7), and Arizona (5). About 70% of the players indicated their residence was in these 4 states. Six players claimed Canada as their residence.

Of the 88 players listed in the sample, 32 players, or 36.4%, were in-state players. Cal, USC, UCLA, and Washington had more than half its players from in-state. Two schools didn’t have any in-state players, Arizona and Oregon.

Residence of PAC-12 Women's Basketball Players
Residence of PAC-12 Women’s Basketball Players

There were 49 out-of-state players from the U.S., 55.7%, and 7 foreign players, 8.0%. Overall, 63.7% of the players were out-of-state.

Individually, the top 6 teams in the conference had winning records. Collectively, they won 69% of their games. As a group, the residence of their players follows:

  • 54% in-state.
  • 41% out-of-state U.S.
  • 5% out-of-state foreign.

The bottom 6 teams had losing records. As a group they won 31% of their games. Collectively, the residence of their players follows:

  • 18% in-state.
  • 71% out-of-state U.S.
  • 11% out-of-state foreign.

For more details see the report Residence of Top Players 2013-2014 PAC 12 Basketball Teams. This report identifies the home state or country of the top PAC 12 basketball players and compares differences between the men and women teams.