Lady Buffs Volleyball Staying Home this Postseason

On Sunday, the NCAA announced the field for their 2015 women’s volleyball championships. The field of 64 included 32 automatic berths for conference championships and an equal number of at-large slots.

The Big 10 has bragging rights for the most number of teams (10) followed by 7 PAC-12 teams and 5 Big 12 teams. The top seeds were: No. 1 University of Southern California, No. 2 University of Minnesota, No. 3 University of Texas, and No. 4 University of Nebraska.

The announcement of the field took an unexpected turn for Colorado Buffs fans. The hometown team finished fifth in the PAC-12 with an 11-9 conference record and a 19-13 overall record. Despite their showing, the Lady Buffs were not invited to attend the Big Dance – yet invitations were extended to the 6th place Ducks (10-10 in conference and 16-13 overall), 7th place Wildcats (9-11 in conference and 19-13 overall) and 8th Sun Devils (8-12 in conference and 19-12 overall).

Here’s the way the conference season unfolded for CU:
• On a positive note, the Buffs swept Arizona, California, and Oregon State.
• The Buffs split matches with Arizona State, Oregon, Stanford, and Utah.
• The Buffs lost one match to Washington and defeated Washington State in one match.
• The Buffs were swept by USC and UCLA

The Buffs played 6 matches with a score of 3-2.
• They defeated Arizona State, Oregon, Oregon State, and Washington State.
• They lost to Oregon and USC.

In pre-conference play, the Buffs were 8-4. They were swept by Penn State (8th at the end of the season) and Illinois (21st at the end of the season). They dropped a 3-1 match at home to San Diego, who received votes in the final rankings. The Buffs other loss came at the hands of Rice, 3-1.

On a positive note, the Buffs had a 3-2 win over Florida State (ranked 19th at the end of the season). The other wins were against teams they shouldn’t have been playing:
• Oklahoma 12-16
• Sam Houston State, 14-18
• Louisiana-Lafayette, 6-23
• Montana State, 3-21
• Weber State, 6-22
• George Mason, 10-19
• Air Force, 12-21.
Combined these 7 teams were 63-140; they won 31.0% of their matches.

The Buffs had “good wins” against Stanford and FSU and at the end of the season they received votes for the top 25. A strong case can be made that the Lady Buffs were a legitimate top 32 team, i.e. they should have been invited to the Big Dance.

A strong case can be made that the Lady Buffs were a legitimate top 32 team, i.e. they should have been in the Big Dance.

If you consider the non-conference “bad losses” to Rice and San Diego and the conference losses to Oregon, Utah, and Arizona State, a strong case can be made that the Lady Buffs should stay at home.

The moral of the story is that competition against good teams and consistency matter!

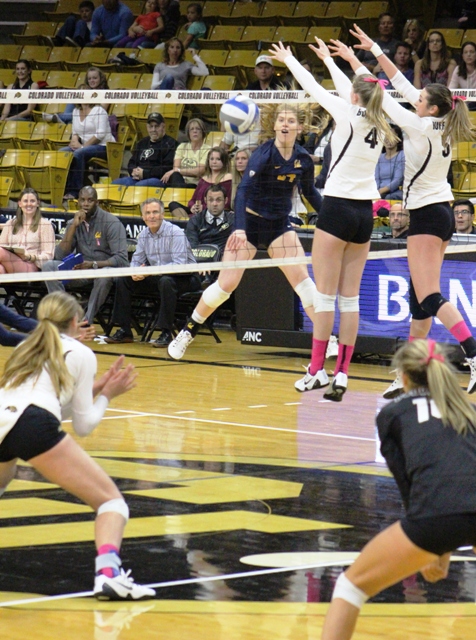
Lady Buffs Sweep California
Lady Buffs sweep California.


Not All Athletes are Dumb Jocks

There is a stereotype that college athletes are dumb jocks. As a result the NCAA set up the Academic Performance Program in 2003 to “incent” colleges to help their students be better athletes, thus eliminating this label.

In late May the University of Colorado released the results of the Academic Progress Rate (APR) report prepared by the NCAA for its 17 programs. Highlights of the report are:
• 13 of 17 team averages exceeded the national average for their sport.
• The men’s cross country team had a perfect four-year APR score of 1000 (top 10 percent in its sport), along with an NCAA Championship and 4 consecutive Pac-12 championships.
• The women’s lacrosse team, completed its second year with a perfect 1000 APR score;
• Five sport programs achieved a perfect 1000 score for the 2013-14 academic year, men’s cross country, men’s skiing, women’s basketball, women’s golf, and women’s lacrosse. (not shown in the table below)
• Football increased its APR performance to a 957 score. In 2008-09 the program had a 919 score that led to a six-scholarship penalty.

This year CU had a composite APR score of 977, well above the penalty level of 930. In other words, not all athletes are dumb jocks.

This score projects graduation rates that will be above those of the general student population. It is common for special groups (music, theatre, clubs, and other organizations, etc.) to have GPAs or academic achievement rates above the school average. In the case of athletics that is also a result of the special academic and tutoring programs established for athletes to help them meet the demands of sports and school.

Go Buffs!

Team 2013-24 APR Four-Year APR 2010-11 to 2013-14 2013-14 Team GPA
Men’s Cross Country 1000 1000 3.015
Women's Lacrosse 1000 1000 3.040
Women's Basketball 1000 995 3.028
Women's Golf 1000 991 3.285
Men's Skiing 1000 980 3.282
Men's Outdoor Track 989 986 2.856
Men's Indoor Track 989 985
Women's Soccer 988 994 3.304
Women's Cross Country 985 996 3.362
Women's Volleyball 979 989 2.874
Women's Indoor Track 979 986
Women's Outdoor Track 979 986 3.152
Men's Golf 976 967 2.845
Women's Tennis 969 983 3.340
Football 966 957 2.703
Men's Basketball 959 975 2.538
Women's Skiing 944 965 3.595
Penalty Level 930 930

Big Ten and Pac-12 Dominate NCAA Volleyball Championships

Once again the women’s  NCAA Volleyball Championships were a showdown between the Big Ten and the Pac-12. The Big Ten captured bragging rights for quality with six teams entered and three of the eight quarterfinalists. The Pac-12 laid claim to the deepest conference, with ten teams entered and one semifinalist.

On December 4th, 64 teams from 31 conferences kicked off regional play for the 34th NCAA women’s volleyball tournament. On December 20th, Penn State won the championship for the second consecutive year.

Each of the six Big Ten representatives won matches. The overall conference record was 17 wins and 5 losses.

Big Ten Won Lost
Penn State 6 0
Wisconsin 3 1
Nebraska 3 1
Ohio State 2 1
Illinois 2 1
Michigan St. 1 1
Conference Total 17 5

Each of the ten Pac 12 teams won matches. Conferences teams were 17-10 in championships.

Pac 12 Won Lost
Stanford 4 1
Oregon 2 1
Oregon State 2 1
UCLA 2 1
Washington 2 1
Arizona 1 1
Arizona State 1 1
Colorado 1 1
USC 1 1
Utah 1 1
Conference Total 17 10

The 16 teams from the Big Ten and Pac-12 conferences won 34 of the 63 matches played in the championships. That is dominance!

Five teams represented the SEC. Florida had three wins and was the only SEC team that had a strong presence in the championships. Texas @&M was the only team that did not win a match.

SEC Won Lost
Florida 3 1
Alabama 1 1
Kentucky 1 1
LSU 1 1
Texas A&M 0 1
Conference Total 6 5

Four teams represented the ACC. North Carolina and Florida posted winning records.

ACC Won Lost
North Carolina 3 1
Florida 2 1
Miami (FL) 1 1
Duke 0 1
Conference Total 6 4

Four teams represented the West Coast Conference. The strongest WCC team was finalist BYU. The Cougars were the only team from the conference to win matches.

WCC Won Lost
BYU 5 1
Loyola Marymount 0 1
San Diego 0 1
Santa Clara 0 1
Conference Total 5 4

With the exception of Texas, the Big 12 was represented by teams that were weak by Big 12 standards.

Big 12 Won Lost
Texas 4 1
Iowa State 1 1
Kansas 0 1
Kansas State 0 1
Oklahoma 0 1
Conference Total 5 5

Combined, the 19 teams from the SEC, ACC, WCC, and Big 12 won 22 matches of the 63 matches played.

There were 5 conferences that had the remaining 7 wins in the championships. CSU was the only team to have two wins.

School and Conference Won Lost
Colorado State Mountain West 2 1
Hawaii Big West 1 1
Long Beach State Big West 1 1
Dayton Atlantic 10 1 1
UALR Sunbelt 1 1
Illinois State Missouri Valley 1 1
Total 7 6

In total, the 41 teams that represented the 11 conferences mentioned above had a combined record of 63-39.

Of the 41 teams representing the 11 conferences mentioned above only 9 teams did not win a match. In addition, there were 24 teams from 20 conferences represented that did not win a match.

Generally speaking, these teams were admitted to the tournament as a courtesy because they were conference champions. While these teams and conferences all have solid programs, they are not competitive with the top teams or conferences. This is evident by the first round match scores for the losers. The majority of first round losers lost their only match 3-0. The summary of first round match scores follows:

  • 23 matches, 71.9%, were 3-0.
  • 5 matches, 15.6%, were 3-1.
  • 4 matches, 12.5%, were 3-2.

For the 31 other matches played (second round through the finals) the  majority of the scores were 3-1, i.e. the matches were more competitive. A summary of these scores follows:

  • 12 matches, 38.7%, were 3-0.
  • 14 matches, 45.2%, were 3-1.
  • 5 matches, 16.15%, were 3-2.

It is clear from the results that there are multiple tiers of ability within the NCAA Division I teams. The good news is that these 64 programs offer athletic opportunities for 600-700 of the country’s top women volleyball players.

Congratulations to Penn State on another NCAA volleyball championship!

Big Ten Dominates NCAA Women’s Volleyball Championships

On December 5th, 64 teams kicked off regional play for the 33rd NCAA women’s volleyball tournament. Teams represented 31 conferences; however, the tournament was essentially a competition between the Big Ten and the Pac 12.

There were 4 Big 10 teams and 3 Pac-12 teams in the quarterfinals. Although Penn State defeated Wisconsin in the finals, the match of the tournament saw Penn State defeat Stanford after being down 9-6 in game 5.

Michigan was the only Big Ten team that did not win a match. All other teams had winning records and conference teams won a total of 23 matches while losing 7.

Big Ten

Won

 Lost

Penn State 6 0
Wisconsin  5 1
Purdue  3 1
Nebraska  3  1
Illinois  2  1
Michigan State  2  1
Minnesota  2  1
Michigan  0  1
Conference Total  23  7


The Pac 12 was also well represented by 9 teams. Only ASU didn’t win a round and 5 teams won a match before bowing out. Conferences teams were 15-9 in championships.


PAC 12

Won

Lost

Washington

4

1

Southern California

3

1

Stanford

3

1

Arizona

1

1

California

1

1

Colorado

1

1

Oregon

1

1

Utah

1

1

Arizona St.

0

1

Conference Total

15

9


The Big Ten and Pac-12 teams won 38 of the 63 matches played in the championships. That is dominance!

Five of the 8 teams representing the SEC won their first round match, but lost in the second round. Overall the conference had a modest performance.

SEC

Won

Lost

Florida

1

1

Kentucky

1

1

LSU

1

1

Missouri

1

1

Texas A&M

1

1

Alabama

0

1

Arkansas

0

1

Georgia

0

1

Conference Total

5

8


Of the 4 ACC teams, only Florida State posted a winning record.


ACC

Won

Lost

Florida St.

2

1

Duke

1

1

Miami (FL)

0

1

North Carolina

0

1

Conference Total

3

4


The Big 12 was represented by 4 quality teams.


Big 12

Won

Lost

Texas

4

1

Kansas

2

1

Oklahoma

1

1

Iowa St.

0

1

Conference Total

7

4


There were 4 conferences that had a total of 8 teams. Each of these had representatives in either the round of 16 or 32.

School

 Conference

Won

Lost

Hawaii Big West

1

1

Cal St. Northridge Big West

1

1

UC Santa Barbara Big West

0

1

San Diego West Coast

2

1

BYU West Coast

2

1

Marquette Big East

1

1

Creighton Big East

1

1

American Univ. Patriot

2

1

Total

10

8


In total, the 41 teams that represented these 9 conferences had a combined record of 63-40.

Then there were the other 23 teams from 22 conferences. Generally speaking, these teams were admitted to the tournament because they were conference champions. While these teams and conferences all have solid programs, they are not competitive with the top teams or conferences.

None of the teams from these conferences won a match. In fact they only won 6 sets while losing 69 sets. Only Colorado State played a “close” match, losing 3-2 to Cal State Northridge.


School Conference Sets Won Sets Lost
Louisville AAC

0

3

New Hampshire America East

0

3

Duquesne Atlantic 10

0

3

Jacksonville Atlantic Sun

0

3

Idaho St. Big Sky

1

3

Charleston So. Big South

1

3

Radford Big South

0

3

UTSA Conference USA

0

3

Milwaukee Horizon

0

3

Yale Ivy

1

3

Fairfield Metro Atlantic

0

3

Ohio Mid-American

0

3

Hampton Mid-Eastern

0

3

Wichita St. Missouri Valley

1

3

Colorado St. Mountain West

2

3

LIU Brooklyn Northeast

0

3

Morehead St. OVC

0

3

Ga. Southern Southern

0

3

Central Ark. Southland

0

3

Alabama St. Southwestern

0

3

IUPUI Summit

0

3

Texas St. Sun Belt

0

3

New Mexico St. Western Athletic

0

3

Total

6

69


It is clear from the results that there are two if not three or four tiers of play within the NCAA Division I teams. The good news is that these 64 programs offer athletic opportunities for 600-700 of the country’s top women volleyball players.

Congratulations to Penn State on their championship season!


NCAA Volleyball – 33 Years in a Row for Stanford and Penn State

There was a time when baseball fans hollered, “Break up the Yankees.” At the time, it was an understatement to say that the Bronx Bombers were dominant.

If these anti-Yankee folks were women’s volleyball fans today they would say, “Break up the Penn State and Stanford programs.”

The first NCAA championships were held in 1981. In the 33 championships, including this season, Penn State and Stanford are the only two teams to appear in every NCAA tournament. That type of dominance makes the New York Yankees look as inept as the Chicago Cubs.

Over the past 33 seasons, Stanford has won 6 NCAA national championships and was runner-up on 8 occasions. As well, they had three undefeated conference seasons.

Since 1981, the overall winning percentage for the Cardinal fell below 65% twice. Their conference winning percentage dropped below that mark only once.

Penn State has been equally as impressive. They won 5 national championships and were runner-up on 3 occasions. They won the national championship four consecutive years (2007 – 2010) and were undefeated in two of those seasons.

As well, they were undefeated in conference play 14 times. Only once did the Penn State overall season winning percentage drop below 65%.

33 years in a row
Sunday evening Texas was announced as the number one seed for the 2013 NCAA tournament. They are the outright favorite to defend their title.

Penn State was seeded second and Stanford was seeded seventh. If they both win their first three matches they will face off in the quarterfinals.

Here’s to an exciting NCAA tournament!


Is Sand Volleyball on the Horizon for CU and CSU?

In 2012 sand volleyball became an “emerging” women’s sport for the NCAA. Fifteen schools kicked off the inaugural season.  Another 15 teams were added this season (2013), with the National Championships on tap the first week in May.

On Friday April 26 CU and CSU put on a sand exhibition at Oasis Sports in Broomfield to increase awareness for the sport along the Front Range.  It appears that it is only a matter of time before the Rams and Buffs will be competing on the sand as part their respective NCAA athletic programs.

Control of Intercollegiate Athletics

It is easy to criticize the NCAA and at times they make themselves an easy target. It is clear that management of college sports has been a challenge since their inception.

The following is taken from the North American Society for Sports History 1981 Proceedings. The two-page document, was authored by Ronald A. Smith, professor at Pennsylvania State University. His comments are particularly interesting given the recent Jerry Sandusky scandal at PSU.

Preludes to the NCAA: Early Failures of Faculty Control of Intercollegiate Athletics

Neither the creation of the National Collegiate Athletic Association in 1905-06 nor the origin of The Intercollegiate Conference of Faculty Representatives (Big Ten) in 1895 was the beginning of inter-institutional faculty control over intercollegiate athletics. The movement for inter-institutional faculty control began in the early 1880s. In 1882 Princeton’s faculty created the first college faculty committee to control athletics which, from the first, had been student controlled. A year later Harvard’s faculty formed an athletic committee. Faculties had been reluctant to take control of athletics from students, but  as the number of contests and the time spent away from campus increased, faculties increasingly moved away from laissez faire positions to paternalistic ones. By 1900 nearly all colleges had created some type of athletic committee under full or partial faculty control. It was a relatively short step for the faculty of individual colleges to move toward inter-institutional control of athletics.

President Charles W. Eliot and his Harvard faculty took the first step toward interinstitutional control when Eliot wrote to other New England presidents on behalf of his faculty asking them to consider joint action concerning professionalism in college sport. There was no positive response, but a year later, in 1883, the Harvard Athletic Committee called a meeting to discuss the professionalism issue. This first gathering of faculty from eight institutions in New York City on December 28, 1883, predated the first conference of the Big Ten by eleven years and was twenty-two years to the day before the original meeting of the NCAA. Resolutions were drawn up and sent to twenty-one eastern institutions with the condition that when five colleges adopted them, they would be binding. Only Harvard and Princeton faculties adopted them, and the first attempt at inter-institutional control was unsuccessful.

Following the football season of 1886 President James McCosh of Princeton sent a circular to other eastern college presidents once again urging intercollegiate cooperation to eliminate athletic abuses. Yale, the dominant athletic school in America, was least interested in joint athletic control. When Yale refused to become involved in the McCosh attempt, the proposal died stillborn. More than a decade and the birth of the midwestern Big Ten Conference passed before another major effort to consider eastern inter-institutional faculty control would surface.

With charges of questionable ethics in athletics, increased professionalism in colleges, and the need for standardized rules, the idea of a permanent organization of colleges working cooperatively appeared again in the mid-1890s. Problems, especially in football and baseball, continued to plague student-controlled athletics. The concerns were numerous. Tramp athletes transferring with impunity from one college to another to participate in athletics, baseball players participating in summer resort leagues for pay, students participating in athletics without making normal progress toward a degree, the hiring of professional coaches, pre-season and summer practices, and the commercialization of athletics through large gate receipts were all prominent concerns. On February 18, 1898, a major conference at Brown University convened to discuss these concerns. All of the colleges of the present-day Ivy League, with the exception of Yale, sent a faculty member, an alumnus, and an undergraduate, but the work of the conference was accomplished by an all-faculty committee. The 1898 faculty committee Report on Intercollegiate Sports was a potent call for cooperative action to cure the evils of intercollegiate athletics.

The Brown Conference Committee Report asserted that colleges “are not engaged in making athletes. . . .” The faculty report indicated that colleges “should not seek perfection in our games, but, rather, good sport.” To bring about what the committee believed was a saner system of athletics, it proposed twenty rules for adoption by the various eastern colleges. Among the rules were insurances for faculty control, ensuring bona fide students, limiting eligibility to four years, restricting contests to home fields of the colleges, eliminating athletic scholarships and summer baseball for pay, and demanding faculty approval of all coaches, captains, and team managers. The proposed rules were never adopted en masse by eastern institutions. The Brown Conference suggestion that yearly conferences be held “to consider regulations and the proper development of the athletic sports” did not bear fruit at this time. The 1898 conference was unable to foist a British-like amateur sport ideal on a fiercely competitive, win-oriented system which had developed in American colleges.

From the 1880s when Princeton and Harvard formed athletic committees and the first attempts at inter-institutional control of athletics were made to the failure of the 1898 Brown Conference, university officials without great success were endeavoring to come to grips with the most visible extracurricular activity in colleges. Not until 1905 when a crisis in football occurred did colleges on a national level join together as they searched for order in athletic affairs.
 

Want to Turn Pro – What are the Chances?

Do you want your son or daughter to earn an athletic scholarship that will allow them to pursue a career as a professional in their sport?

The NCAA research department has compiled data that sheds light on the prospects of achieving that goal. As will be shown below, the chances of going pro are greatest for athletes who pursue professional careers in baseball or hockey.

Men’s Basketball
• Less than 1 in 35 high school seniors play in the NCAA.
• About 1 in 75 NCAA seniors get drafted by an NBA team.
• 3 in 10,000 high school seniors play in the NCAA and are drafted by an NBA team.

Women’s Basketball
• About 3 in 100 high school seniors play in the NCAA.
• Less than 1 in 100 NCAA seniors get drafted by a WNBA team.
• 2 in 10,000 high school seniors play in the NCAA and are drafted by a WNBA team.

Football
• About 1 in 16 high school seniors play in the NCAA.
• Less than 1 in 50 NCAA seniors get drafted by a NFL team.
• 8 in 10,000 high school seniors play in the NCAA and are drafted by an NFL team.

Baseball
• About 3 in 50 high school seniors play in the NCAA.
• Less than 9 in 100 NCAA seniors get drafted by a MLB team.
• 1 in 200 high school seniors play in the NCAA and are drafted by an MLB team.

Men’s Ice Hockey
• About 11 in 100 high school seniors play in the NCAA.
• Less than 1 in 26 NCAA seniors get drafted by a NHL team.
• 1 in 300 high school seniors play in the NCAA and are drafted by an NHL team.

Men’s Soccer
• Less than 3 in 50 high school seniors play in the NCAA.
• Less than 1 in 50 NCAA seniors get drafted by a MLS team.
• 1 in 1,250 high school seniors play in the NCAA and are drafted by an MLS team.

The data presented above and in the table below was updated on September 27, 2011 and posted at www.ncaa.org. These percentages are based on estimated data and should be considered approximations of the actual percentages (NCAA disclaimer).

Clearly, academics have to be important to most of the athletes who participate in college programs.


Football Players Cluster to the Same Majors

Several weeks ago AP sports writer Paul Newberry penned an article published in the Daily Camera entitled, “College Athletes Cluster to Same Majors.” The AP research looked at the majors declared by football players at 68 universities which had received  automatic bids to the Bowl Championship Series. In short, Newberry indicated that football players favored majors in general studies and management.

It is common for groups of select students with similar interests to declare similar majors. For example members of the marching band are more likely to be music majors and members of certain sororities are likely to have a high concentration of students in business or communications.

In this case, clustering, as it is called occurs because football players seek majors that complement their practice and travel schedules. In many cases these majors may be less rigorous and require less time in the library. (Note: all research studies are careful not to refer to these as Mickey Mouse majors).

The AP study looked at sophomores, juniors, and seniors and did not include players who had not declared a major. Information was tallied from university media guides or websites, and information provided by the schools. The study found that clustering was prevalent at 39 of the 68 schools. The leaders in clustering are:

  • Georgia Tech            Management                                              43 players
  • Cincinnati                 Criminal Justice                                         40 players
  • Vanderbilt                 Human/Organizational Development  35 players
  • Wake Forest             Communications                                        34 players
  • Mississippi State     Kinesiology                                                  30 players
  • LSU                            Sports Administration                              28 players
  • UCLA                         History                                                         27 players
  • Baylor                        General Studies                                          27 players
  • Kansas                       Business                                                       25 players
  • Iowa                           Interdepartmental Studies                       21 players
  • Boston College         Communications                                        21 players
  • Clemson                    Sociology                                                      20 players

A review of other commentary on the topic shows the following:

  • Clustering is a common trend, more prevalent since the NCAA instituted the Academic Progress Rate. The APR was a mandate intended to force schools to have their athletes take classes that led to a degree that would lead to employment upon graduation.
  • Clustering varies between sports and schools.
  • Because school scan lose scholarships if APR numbers are not met, it is believed that counselors push athletes into less rigorous degrees.
  • It seems logical for athletic programs to recruit players to majors where players have had success in the past and it seems logical for athletic programs to promote those academic disciplines.
  • The NCAA claims that the APR program has increased graduation. While it is important for students and athletes to graduate, it is more important for them to receive an education that increases their chances of being hired.
  • The NCAA has conducted research that shows that about 80% of athletes are content with their majors.

Newberry’s research and the research of others illustrates how closely college athletic programs are being monitored in all aspects of their business.

Is clustering a problem? Probably not. Does clustering benefit the athletes? Possibly.