CU Buffs Football Attendance Up in 2015

The hard cold facts about college football are that every Saturday half the teams are losers. And the CU Buffs are doing their best to make their opponents feel good about themselves on the weekends.

Over the past decade the abysmal win-loss record of the CU Buffs football team has given fans a reason to find other things to do on Saturday afternoons than support the black and gold.

The problems began over a decade ago. The Buffs finished the 2004 and 2005 seasons with 7-5 records. In 2004 they were 4-4 in the Big 12 and in 2005 they were 5-3. Oklahoma beat them 42-3 in the 2004 Big 12 Championships and Texas thumped them 70-3 the following year.

Many viewed these drubbings in the championships as a sign that CU was not capable of participating in the D1 football race to see which program could spend the most money. The CU administration viewed the losses differently. They used them as justification for hiring a new coach.

In retrospect, those days of getting slaughtered in the Big 12 championships were the good old days. The Buffs football team has not had a winning season since 2005.

In 2011, dollar signs flashed in front of the CU administrators and CU jumped from the Big 12 to the PAC-12 conference. Unfortunately the Buffs found out the PAC-12 also had teams that knew how to play football.

Since 2011, the Buffs have had five conference wins – three on the road and two at home. Details follow:

Year Conference Record Comments
2011 2-7 conference record Home win over Arizona and a road win against Utah.
2012 1-8 conference record Road win over Washington State.
2013 1-8 conference record Home win over California.
2014 0-9 conference record Ugh!
2015 1-8 conference record 17-13 squeaker in Corvallis

Unfortunately, the Buffs conference home attendance has paralleled the number of wins on the field.

2011
The Buffs were 1-4 at home in conference play.
• 9/10 49,532 California
• 10/1 51,928 Washington State
• 10/22 52,123 Oregon
• 11/4 50,083 Southern California
• 11/22 48,111 Arizona.
Average conference home attendance 50,355.

2012
The Buffs were 0-5 at home in conference play.
• 9/29 46,893 UCLA
• 10/11 45,161 Arizona State
• 10/27 44,138 Stanford
• 11/17 43,148 Washington
• 11/23 46,052 Utah.
Average conference home attendance 45,078.

2013
The Buffs were 1-3 at home in conference play.
• 10/5 45,944 Oregon
• 10/26 38,679 Arizona
• 11/16 38,252 California
• 11/23 36,005 Southern California.
Average conference home attendance 39,720.

2014
The Buffs were 0-5 at home in conference play.
• 9/13 38,547 Arizona State
• 10/04 36,415 Oregon State
• 10/24 37,442 UCLA
• 11/1 35,633 Washington
• 11/29 39,155 Utah
Fewer than 40,000 people attended every home game and average conference home attendance was 37,438.

2015
The Buffs were 0-5 at home in conference play.
10/3 46,222 Oregon
10/17 39,666 Arizona
10/31 51,508 UCLA
11/13 37,905 USC
11/28 45,823 Utah
The downward trend in attendance has been reversed. Average home attendance for the 2015 home conference games was 42,225 and Buffs fans were usually treated to a good show. Even though they were 0-5, they lost the five home games by a total of only 37 points.

Buff fans have to be the most loyal in the country. Despite going 2-22 at home since joining the PAC-12, they still keep showing up. Here’s to a better 2016! The CU Athletic Department needs fans in the seats to provide better funding for the Olympic sports.

Buffs Waiting for a Bowl Berth?

On November 16th the Daily Camera sports department ran an article titled, “Buffs Clinging to Dim Hope for a Bowl Berth.” Excerpts from the article follow.

A whopping 80 bowl game spots are available this year. Of the 128 teams in the FBS, 62 teams have already earned bowl eligibility, while 34 have no chance of getting to the magic number of six wins.

Among the other 32 teams, 18 are just a win away from the six-win mark.

That leaves 14 other long shots that haven’t had good seasons to this point, yet still cling to hope.

Colorado is among the 14.

CU’s hope, however, stems from the fact that there might actually be a shortage of bowl eligible teams this season. If that’s the case, a 6-7 CU team could slip in through the back door and go bowling.

With all due respect to the players, coaches, and program – the Buffs don’t deserve a bid to a bowl. The team made progress this season, but they are a losing program that finds new and exciting ways to continuing being a losing program. It is actually sad.

At this point in the season the Buffs are 4-7. They started off the season 3-1, with wins over Massachusetts (2-8), CSU (5-5), Nicholls State (2-8), and Oregon State (2-8). Combined these four teams have won only 11 games while losing 29. Ouch!

The story gets worse.
• Massachusetts had wins over Eastern Michigan (1-9) and FIU (5-6) – total 6-15.
• CSU beat Savannah State (1-8), University of Texas San Antonio (2-8), Air Force (7-3), Wyoming (1-9), and UNLV (3-7) – total 14-39.
• Nicholls State beat Lamar (5-5) and Houston Baptist (2-8) – total 7-13.
• Oregon State beat Weber State (5-5) and San Jose State (4-6) – total 9-11.
These four schools won 11 games. Only one of their opponents had a winning season (CSU beat Air Force). The combined record of these programs was 36-78.

In other words, CU was only able to beat teams that were capable of defeating only really weak programs.

This season will cap off a decade of losing seasons, although things were only slightly better in 2005 when they were 7-6. In the past nine seasons the Buffs were 31-79.

Here’s to a better season in 2016. The athletic program need a winning football team to generate more revenue to provide greater support for the minor sports.

CU Football – Charting a Path to Effective Leadership

Since CU football began in 1890, the Buffs have had an impressive run, 673–452–36. During these 125+ years, Buff fans have been treated to the athleticism and leadership of athletes such as Dick and Bobby Anderson, Cliff Branch, Tom Brookshier, Darian Hagan, and Whizzer White.

Unfortunately, the Buffs have fallen on lean times for the past nine years, including two years under Coach MacIntyre. During this period the team was 31-79 overall and 16-60 in conference play. In the two seasons under Coach MacIntyre the team was only 6-18; however, those close to the program are quick to point out they have high expectations for the team because they believe his record does not reflect the team’s improvement.

Since taking over MacIntryre has addressed a myriad of issues ranging from recruiting to academics to facilities. Recent team updates in the local media have highlighted MacIntyre’s experiment to strengthen leadership within the program.

He has announced that each game he will rotate four captains from a 12-person leadership council. The council members are primarily upperclassmen and a mix of offensive and defensive players. MacIntyre emphasized that council members were “carefully” elected by the players. Council members have the responsibility/privilege of attending leadership meetings conducted by the Athletic Department in addition to the regularly scheduled council meetings.

In addition, MacIntyre has made a concerted effort to inform the entire team about the importance of effective leadership and the qualities of strong leaders. The coach is to be commended for his efforts to change the culture of leadership within the program.

But, will it have an impact on the team in the short run?leadership from any chair

MacIntyre’s experiment parallels current trends in the business world to implement flat leadership or “leading from any chair.” Organizational theory experts have identified the following benefits of this style of leadership in the business world:
• The concept has increased creativity and innovation in some companies.
• A greater number of workers have a chance for their ideas to be heard.
• In turn, workers may take on greater responsibility and be more willing to be held accountable for their actions.
• Workers may show more initiative because they have a greater sense of importance.
• Cooperation, cohesiveness, and teamwork may improve when a project is successful.
These are great reasons for adopting this style of leadership.

As with any leadership style, “leadership from any chair” has its flaws. Experts have criticized the style for the following reasons:
• The concept is great for creating new products, but not so great at creating new leaders.
• The workplace becomes inefficient because there are no designated leaders to resolve disagreements or curb jealousy and backstabbing.
• At times companies have difficulty making quick or important decisions because there are no designated leaders.
• Although everyone has a voice, groupthink is often an unintended consequence.
• Communications may not always be efficient because too many people may be involved in the decision-making process.
• Mentorship does not occur in the “me first ” environment.
• Not all workers are comfortable with this style of leadership, which renders it ineffective.
These are great reasons for MacIntyre to adopt a more traditional approach for strengthening team leadership.

Will MacIntyre’s leadership experiment seal the deal for the Buffs or will it be a bust?

In a couple of weeks the team will demonstrate whether Coach Mac was able to chart a new path to effective leadership for the Buffs. Go Buffs!

Two Points a Set – CU’s Long and Winding Road to Improvement

Since 2007, the University of Colorado Women’s Volleyball program has been challenged to put a team on the court that wins in conference play. This post presents data that documents the improvement made by the Lady Buffs from 2009 to 2014.

Background

In 2006 the Lady Buffs won 49.5% of the points in conference competition, they qualified for the NCAA Championships, and were ousted in the second round. Data for 2006 and 2007 are not included in this discussion because sets were played to 30 points at that time.

In 2007 CU only won a single conference match with virtually the same team that had won the first round in the 2006 NCAA Championships.

In 2008, the rules were changed and sets were played to 25 points. The fortunes of the Lady Buffs improved slightly – they won seven matches.

In 2009 changes were made in the CU program and Liz Kritza took over as coach. Her teams won six out of 62 matches in her first three seasons.

The Buffs switched to the PAC-12 Conference in 2011.

In the inaugural PAC-12 season there were 22 conference matches. For purposes of discussion in this post, the data for 2011 has been adjusted to make it comparable to other years. Twenty matches were played in 2012 and subsequent years.

In 2012 the Lady Buffs won four of twenty matches. They were victors half the time when their 2013 and 2014 totals are combined.

Results

The 2009 conference season was abysmal. The Lady Buffs were not competitive – they won their fewest number of points (1,205) and lost their least number of points (1,609).

To become a competitive team it was necessary for the Lady Buffs to win more points. At the same time they needed to lose fewer points.

As can be seen by fast forwarding to 2014, the Lady Buffs have made progress. IT IS IMPORTANT TO NOTE HOW SLOW THAT PROGRESS HAS BEEN.

They won half the points played in 2014, were 11-9 in conference play, qualified for the NCAA Championships, and won their first round match. For the sake of comparison, the 2014 points won/lost for CU, Stanford, and Nebraska follow:
• CU 1,651 points won and 1,648 points lost.
• Stanford 1,774 points won and 1,493 points lost. Stanford lost in the NCAA semis to champion Penn State.
• Nebraska 1,633 points won and 1,500 points lost. Nebraska lost in the NCAA quarters to finalist BYU.

As can be seen, the Lady Buffs are half-way to becoming an elite team. They are now winning about 1,600 points per season. Unfortunately, they have consistently lost at least 1,600 points per season since 2008. That total will have to be reduced to about 1,500 for CU to move to the next level.

Year Points Won Points Lost % Points Won Record
2008 1,512 1,707 47.0% 7-13
2009 1,205 1,609 42.8% 2-18
2010 1,302 1,639 44.3% 3-17
2011 adjusted 1,304 1,629 44.5% 1-21
2012 1,354 1,655 45.0% 4-16
2013 1,516 1,635 48.1% 9-11
2014 1,651 1,648 50.0% 11-9

Points Won by Year

In 2008 the Lady Buffs won 1,512 points. Point production dropped to 1,205 when the team cratered in 2009. It didn’t return to the 2008 level until 2013 when the team reached 1,516 points.

Year Points Won Difference Prior Year Avg. Diff. Points/Match Avg. Diff. Points/Set
2008 1,512
2009 1,205 -307 -15.4 -4.7
2010 1,302 97 4.9 1.3
2012 1,354 50 2.5 0.7
2013 1,516 162 8.1 2.2
2014 1,651 135 6.8 1.7

There was little change in the points won between 2010 and 2012. On average the Lady Buffs found a way to win 7-8 additional points each match or about 2 additional points per set throughout both the 2013 and 2014 seasons.

TWO POINTS A SET! That sounds so easy.

The data shows there is a fine line between the number of points won for a 4-16 team, a 9-11 team, and a team with an 11-9 record. For additional information, see the report Team Tendencies and the Importance of Winning a Point.

Two Points a Set

Percentage of Points Won – Stanford, Nebraska, and CU Volleyball

What is the difference in the percentage of points won for winners and losers?

The top teams in the country win slightly more than half the points they play in conference matches. At the other end of the pecking order the worst teams in the country win 40% to 45% of the points they play.

As expected, teams that win about half the points will win about half the sets and about half their matches.

To illustrate this point, consider the 2006 and 2014 University of Colorado teams.

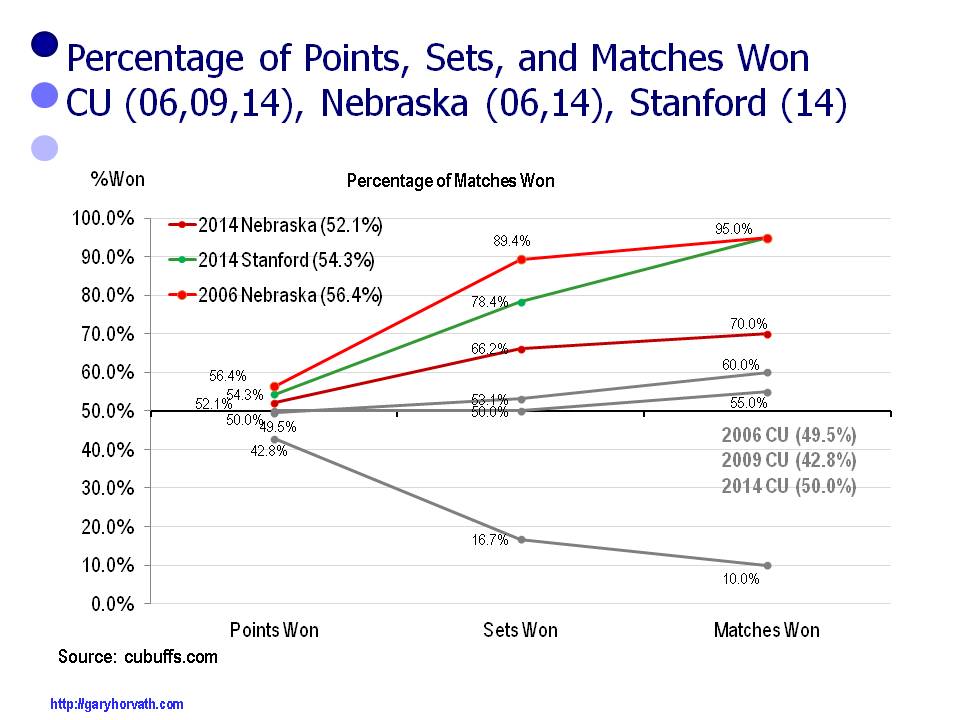
During the 2006 conference season the Lady Buffs won:
• 49.5% of the points
• 53.1% of the sets
• 60.0% of the matches.
During the 2014 season the Lady Buffs won:
• 50.0% of the points
• 50.0% of the sets
• 55.0% of the matches.
Both seasons the Lady Buffs were invited to the NCAA Championships and won their first round matches before bowing out.

When teams win less than half the points they win a much smaller percentage of the sets and an even smaller percentage of the matches. A prime example was the 2009 CU Lady Buffs.

During the 2009 season the Lady Buffs won:
• 42.8% of the points
• 16.7% of the sets
• 10.0% of the matches.
They had one of the poorest records in the country for Division I teams.

When teams win more than half the points those wins are magnified. A greater percentage of sets are won and an even greater percentage of matches are won.

During the 2014 season the Nebraska Cornhuskers won:
• 52.1% of the points
• 66.2% of the sets
• 70.0% of the matches.
The Cornhuskers lost 3-0 to finalist BYU in the quarterfinals of the NCAA Championships.

The 2014 Stanford Cardinal team won:
• 54.3% of the points
• 78.4% of the sets
• 95.0% of the matches.
The Cardinal lost to champion Penn State in the semifinals.

The 2006 Nebraska Cornhuskers won:
• 56.4% of the points
• 89.4% of the sets
• 95.0% of the matches.
The Cornhuskers were National Champions in 2006. Their only loss was to the Lady Buffs, a team that won less than half its points in conference play. Despite their one loss, this Husker team was incredibly dominant.

The data shows there is a fine line between the percentage of points won for the best and the worst teams in the country. For additional information, see the report Team Tendencies and the Importance of Winning a Point.

Percentage of Points Won - Stanford, Nebraska, CU

Percentage of Points Won – Two Points Per Set

Over the course of a season what is the percentage of points won, sets won, and matches won by a college volleyball team? More importantly, what is the value of two points per set?two points per set

The report Team Tendencies and the Importance of Winning a Point takes an in-depth look at those percentages for the University of Colorado Women’s Volleyball team for the nine-year period from 2006 to 2014.

The Lady Buffs won between 42.8% and 50.0% of the points. The range from low to high is 7.2 percentage points. In other words, there are subtle differences between being a winner and a loser.

In 2009 the Lady Buffs won 42.8% of the points.

At the other end of the spectrum they won 49.5% of the points in 2006 and they won 50.0% of the points in 2014. Both years they qualified for NCAA nationals and won their first match at the Big Dance.

The range of 7.2 percentage points for points won (50.0%-42.8%) is magnified to a range of 38.6 percentage points for sets won (53.1% – 14.5%). In turn there is a  range of 55.5 percentage points (60.0% – 4.5%) for matches won.

During the 2009 season the Lady Buffs won:
• 42.8% of the points
• 16.7% of the sets
• 10.0% of the matches.
The Lady Buffs won two of twenty matches. As can be seen, when less than half of the points are won, there is an increased reduction in the percentage of sets and matches won.

During the 2014 season the Lady Buffs won:
• 50.0% of the points
• 50.0% of the sets
• 55.0% of the matches.
The Lady Buffs won eleven of twenty matches. As can be expected when half the points are won there is minimal magnification of sets and matches won.

During a conference season the Lady Buffs play 20 matches. This is about 3,000 points and 75 sets.

If the Lady Buffs win 50.0% of the points, as they did in 2014, they would win 1,500 points. If they win 44.5% of the points, as they did in 2009, they would win 1,335 points during the season.

The difference is 165 points.

If those points are spread evenly over 20 matches, the average difference is 8.25 points per match. If 165 points are spread over 80 sets that means the average difference is 2.1 points per set. If you look at it from that perspective the difference between being the worst in the conference and qualifying for the NCAA championships is about eight points per match or two points per set.

The Bottom Line: As a coach or a player how can you find a way to win at least two points per set?

two points per set - percentage of points, sets, and matces won

Women’s Volleyball Team Tendencies

The women’s volleyball scores for the University of Colorado were evaluated for the nine-year period 2006 to 2014. In addition, scores were included for select Nebraska and Stanford seasons. From this analysis points won, sets won, and matches won, the following team tendencies were developed.

The following definitions are used in the description of the different levels.
Blowouts – decided by 10 points or more.
Solid – decided by 5 to 9 points.
Competitive – decided by 3 or 4 points.
Close – decided by 2 points.

Tier I Teams
• Win more than 53% of the points.
• Don’t lose blowout sets and less than 10% of sets are solid losses. They don’t give opponents a chance to get into the match.
• Win a majority of the close and competitive sets.
• At least 35% of the sets are solid wins
• At least 10% of the sets are blowout wins.
• Win at least 80% of their matches and most wins are 3-0.

Tier II Teams
• Win between 50.1% and 53.0% of the points.
• May lose a few blowout and solid loss sets.
• Win a majority of close and competitive matches.
• About 30% of their sets are solid wins and 5% are blowouts.
• Win at least 66% of their matches and most wins are 3-0 or 3-1.

Tier III Teams
• Win 48.1% to 50% of the points.
• Less than 10% of sets lost are blowouts and 20% solid losses.
• Sometimes win a majority of the close and competitive matches.
• Win about 20% of the sets are solid wins
• May win a few blowout sets.
• Win about half their matches.

Tier IV Teams
• Win between 45.1% and 48% of the points.
• About 20% of their sets are blowouts and 25% are solid loses.
• Most losses are 3-0 or 3-1.
• Win about 35% of their sets and matches.

Tier V Teams
• Win less than 45.1% of their points.
• More than half their sets are solid losses or blowouts.
• A majority of their matches are lost 3-0.
• Win less than 30% of their matches.

The above hierarchy will allow coaches to identify where their team falls in the peaking order and provide them with coaching that will help them move up the pecking order.

For additional information, click here and go to the report Team Tendencies and the Importance of Winning a Point.

CU Football Ranked Again – Number One

Santa Claus delivered an early Christmas present to the University of Colorado football team and its fans – a number one ranking. Go Buffs!

The December 22nd issue of Forbes Magazine featured its annual ranking in “College Football’s Best And Worst Teams For The Buck 2014”. The Buffs were ranked #1 – the worst investment in college football.CU Football Ranked

Author Chris Smith stated, “Across the last three seasons, no team has spent more per football victory than Colorado, our pick for the sport’s worst team for the money. The Buffaloes have won just seven games in that time, tied with Kansas for the least of any team in our pool, while spending over $50 million. To put that into perspective, Mississippi State has built a competitive SEC program while spending $44 million across the same time period,”

To be exact, the Buff footballers spent $51.4 million over three years. Basic math shows that each of the seven wins cost $7.34 million.

Just think how it must feel to be one of the seven teams that lost to the Buffs! Thank goodness those seven teams were inept; otherwise the cost for CU to win a game would be much higher.

This notoriety is of the same ilk as the university’s #1 ranking (multiple years) as the top party school in the country. In addition, the Leeds School of Business is continually ranked as one of the country’s weakest business schools in the country and the worst in Colorado.  Bummer!

The article proves that if you are good at math, it is possible to calculate virtually anything – meaningful or meaningless. While a case can be made that the Forbes calculations fall into the latter category, they point to a larger challenge for CU.

CU clearly does not have the money to build the facilities, attract the top athletes and coaches, and be competitive with the elite football teams in the PAC-12 and the country.

Will they retain the number one ranking in 2015? Probably not!

More importantly, where will they be able to find the money to play with the big boys? Smoke and mirrors? An unsuspecting sugar daddy? The state will triple its funding for the university?

A more likely option would be for CU to lower its academic standards or look the other way to become a winner. The only cost involved in that type of decision would be their reputation.

In the mean time Buff fans can only hope that Forbes and Chris Smith have somewhere else to look when the article is penned for 2015.


CU Buffs Football Team – Attendance Slips Further

The primary goal of Division I football teams is to win and make money; however, the hard cold facts are that half the teams that play every Saturday are losers.

Over the past decade the abysmal win-loss record of the CU Buffs football team has given fans a reason to find other things to do on Saturday afternoons than support the black and gold.

The problems began a decade ago.

The Buffs finished the 2004 and 2005 seasons with 7-5 records. That is outstanding by today’s standards.

In 2004 they were 4-4 in the Big 12 and in 2005 they were 5-3. Oklahoma beat them 42-3 in the 2004 Big 12 Championships and Texas thumped them 70-3 the following year.

Many viewed these drubbings in the championships as a sign that CU was not capable of participating in the D1 football race to see which program could spend the most money.

The CU administration viewed the losses differently. They used them as justification for hiring a new coach.

In retrospect, those days of getting slaughtered in the  Big 12 championships were the good old days. The Buffs football team has not had a winning season since 2005.

In 2011, dollar signs flashed in front of the CU administrators and CU jumped from the Big 12 to the PAC-12 conference. Unfortunately the Buffs found out the PAC-12 also had teams that knew how to play football.

Since 2011, the Buffs have had four conference wins – two on the road and two at home. Details follow:

Year Conference Record Comments
2011 2-7 conference record Home win over Arizona and a road win against Utah.
2012 1-8 conference record Road win over Washington State.
2013 1-8 conference record Home win over California.
2014 0-9 conference record Ugh!

Unfortunately, the Buffs conference home attendance has paralleled the number of wins on the field.

2011
The Buffs were 1-4 at home in conference play.
• 9/10 49,532 California
• 10/1 51,928 Washington State
• 10/22 52,123 Oregon
• 11/4 50,083 Southern California
• 11/22 48,111 Arizona.
Average conference home attendance 50,355.

2012
The Buffs were 0-5 at home in conference play.
• 9/29 46,893 UCLA
• 10/11 45,161 Arizona State
• 10/27 44,138 Stanford
• 11/17 43,148 Washington
• 11/23 46,052 Utah.
Average conference home attendance 45,078.

2013
The Buffs were 1-3 at home in conference play.
• 10/5 45,944 Oregon
• 10/26 38,679 Arizona
• 11/16 38,252 California
• 11/23 36,005 Southern California.
Average conference home attendance 39,720.

2014
The Buffs were 0-5 at home in conference play.
• 9/13 38,547 Arizona State
• 10/04 36,415 Oregon State
• 10/24 37,442 UCLA
• 11/1 35,633 Washington
• 11/29 39,155 Utah
Fewer than 40,000 people attended every home game and average conference home attendance was 37,438.

Given these numbers, it’s a tough time to be the football coach or athletic director at the University of Colorado. Buff fans can only hope for a turn-around in 2015.

Talk of Bowl Game for CU Buffs

Brian Howell, Sports Writer for the Daily Camera is a homer (and there is nothing wrong with that.)  On August 23 he wrote an editorial entitled, “Talk of bowl game for CU Buffs has merit this season.”

Howell began the article with the following comments:
“During fall camp this month, a handful of media members stood just outside of the practice fields and discussed the possibilities for the 2014 Colorado football team.
‘Am I crazy to think this team could get to a bowl game?’ one of them asked.
No, believe it or not, it’s not crazy.”
Later he added “Without question, this team is going to need some good fortune along the way to reach bowl eligibility, but no, it’s not crazy to think they can get there.”

Howell thought it was possible the Buffs could sweep the non-conference slate. He was correct until they played the CSU Rams in the season opener. Oops! Thank goodness the Buffs found a way to sneak past Hawaii and UMass. Both Buff opponents are 2-7 at this point in the season.

Later in his article Howell stated, “And, don’t think the Buffs are going to be happy with showing progress by turning blowout losses into narrow losses.”

Howell indicated possible conference wins might come against the following teams:
• California – Buffs lost 59-56 in OT
• Arizona State – Buffs lost 38-24.
• Oregon State – Buffs lost 36-31
• The Buffs will play Arizona on November 8th and Utah on November 29th.
With today’s loss to Washington, the Buffs bubble burst and they dropped to 2-7.With a little luck they will end the year 4-7. Most likely it will be 3-8 or 2-9.

The good news is the Buffs were stronger and they had greater entertainment value this season. From an academic perspective the Buffs will also have an opportunity to focus on their studies this December, while other teams have to focus on winning bowl games. And to top it off, they are blessed with a local sports writer is aDoormat - Bowl Game for CU Buffs homer (and there is nothing wrong with that).

On the downside, there are no moral victories when you play football in the big time. The Buffs are still the doormats of the PAC-12 and ticket sales have reportedly continued on a downward path. Thank goodness CU is playing in the PAC-12. Things would be even worse if they were in one of the top two conferences, the SEC, or the Big 12.

As is the case with the Chicago Cubs, there is always next season.