2016 Colorado High School Girls Tennis Season Around the Corner

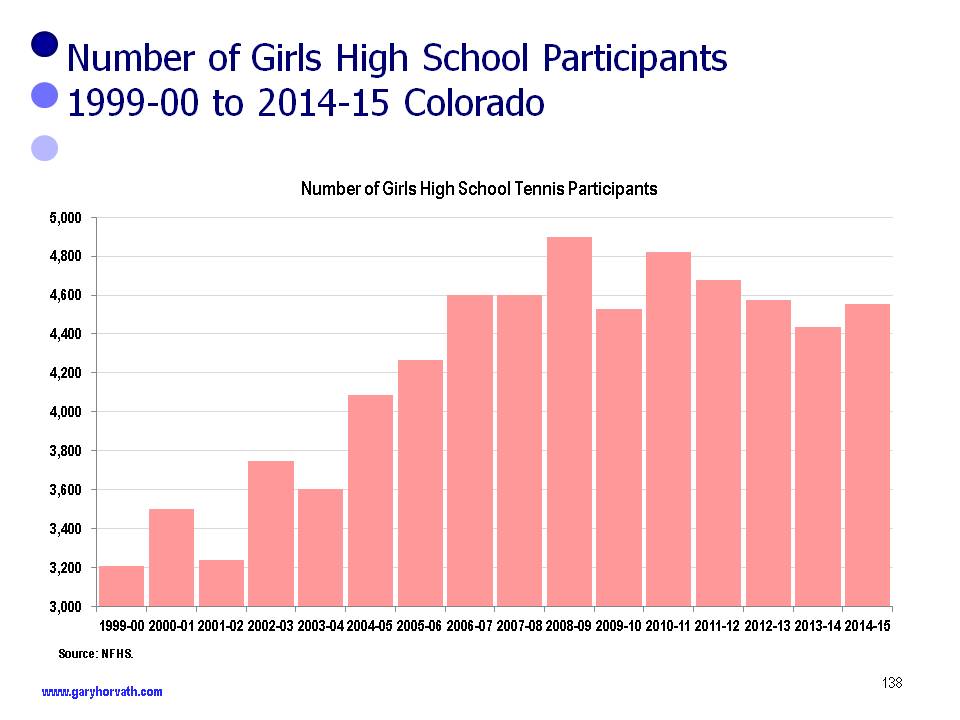
Every year the Colorado high school spring sports season kicks off in mid to late February 29. For tennis fans that means about 4,500 girls will be hitting the courts in 150 locations. The boys are lucky. Their season is in the fall.

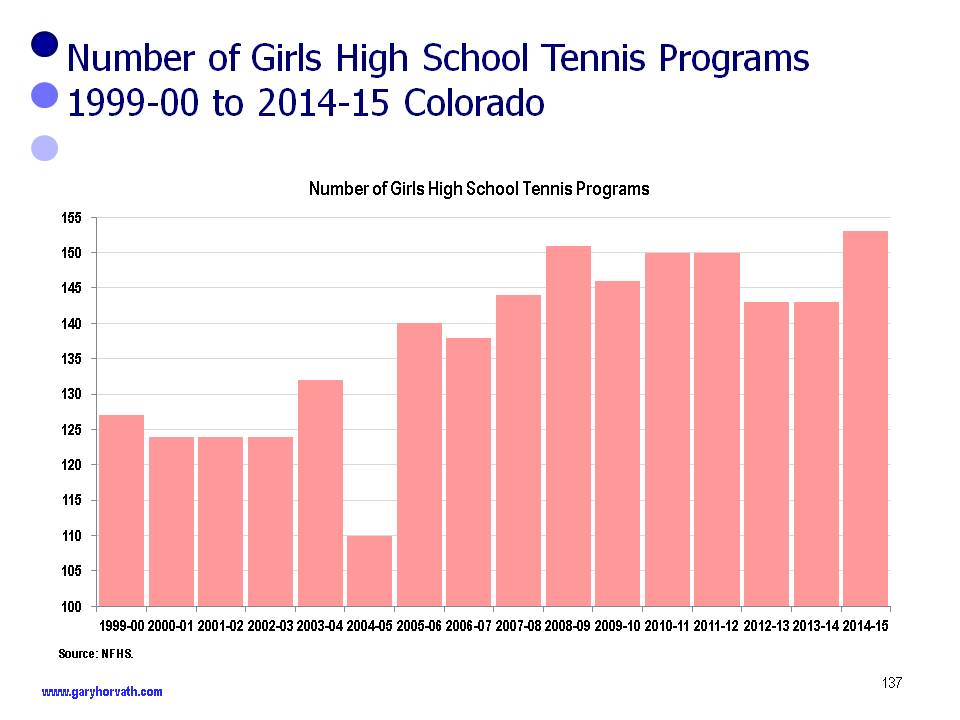
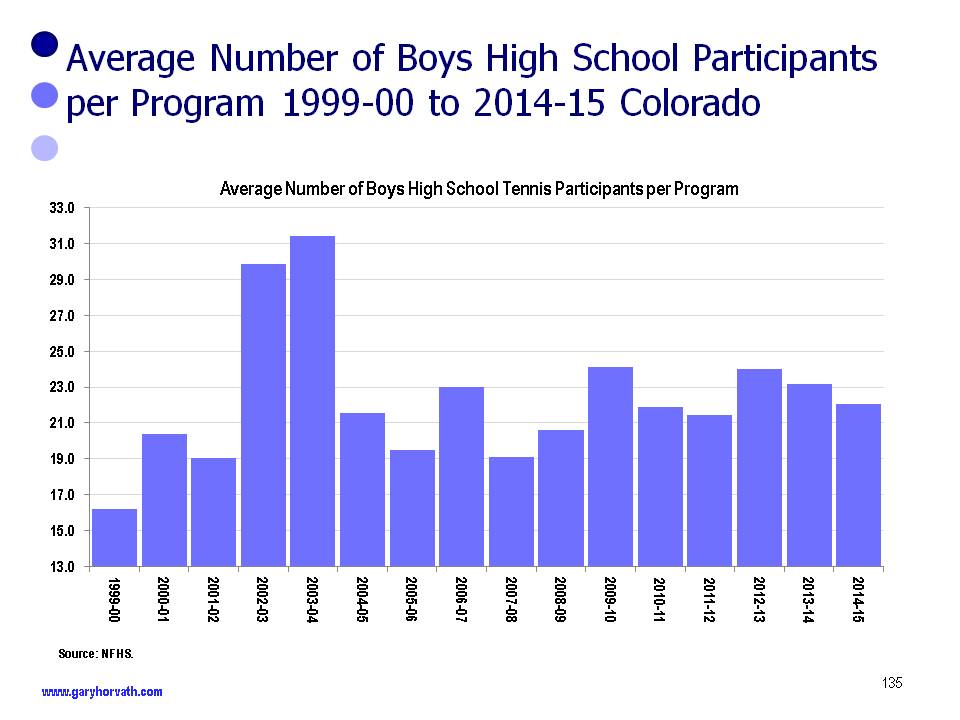
More precisely, the NFHS reported that 4,552 girls played on 153 teams during the 2014-2015 Colorado high school girls season. Despite the popularity of tennis, the number of participants has tapered off since a peak in 2008-2009. That season there were 151 programs and a peak of 4,901 participants.

The varsity season can be summed up as follows:
• The varsity season spans 59 days with a starting date of February 29th and an end date of April 27th, the final day of the regional tournament.
• There are 38 school days during the season and there are 21 scheduled off days. There will be 31 days of matches and practices and 28 days of unscheduled and scheduled off days.
• During the season, there are approximately 29 hours spent in practice and 21 hours spent in competition.

Colorado High School Girls Tennis

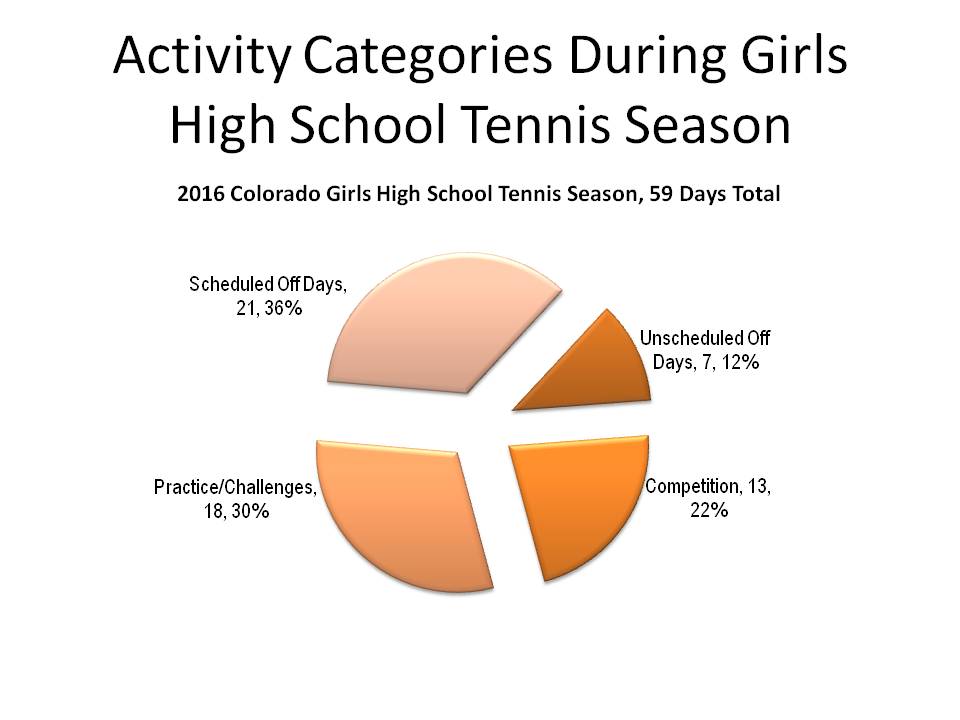
More specifically, the activity for the varsity season can be classified in four categories: competition, practice, unscheduled off days, scheduled off-days.
• Competition (matches and tournaments) CHSAA restricts the number of tournaments and matches that teams can play.
― It is estimated that players will play 4 matches in 3 days of tournaments. Those four matches will each last 1.5 hours per match. Athletes will play 6 hours in tournament competition during the season.
― It is estimated that players will play 10 days of dual matches. The average time of each match will be 1.5 hours. Approximately 15 hours will spend playing dual matches.
― The total time spent in competition is 21 hours.
• Practice and challenge matches – Coaches will plan to have 25 days for practice and challenge matches. In a best case scenario they will get 18 days for these activities.
― It is assumed the team will spend 3 days playing challenge matches or mini-matches to determine the lineup. During this time, a player will play 3 matches/mini matches. On average each of the 3 matches will take 1 hour, for a total of 3 hours.
― The team will have 15 days of practice scheduled for 2 hours. In a best case scenario a team will practice for 1.75 hours on those 15 days for a total of about 26 hours.
― The total time on court is about 29 hours. This is a best case scenario.
• Unscheduled off-days – As previously mentioned, coaches plan for 25 days of practice and challenge matches. Inevitably, there are at least 7 days where no time is spent on the court.
― The biggest challenge facing spring sports is the weather. There is usually at least 5 days where there is inclement weather. During some years this number may approach 10 days.
― There will be at least 2 days for school-related activities where no tennis is played. This includes photo days or unforeseen events. Sometimes coaches will give the team time off after they have played back-to-back matches. Other coaches give players the Friday off before Spring break.
― This estimate projects there will be 7 days when players are involved in non-scheduled activities. That number may be as high as 12 days.
• Scheduled off-days – During this 59-day period there are 21 scheduled off-days.
― There are 5 days for spring break.
― There are 16 weekend days.

The total on-court activity is 50 hours during the 59 day season. This breakdown is similar at many of the top schools and will vary based on the weather, qualifications of the coach, budget, and the number of players and courts.

It is great that girls have an opportunity to play in a high school tennis program. At the same time it is a challenge for high school athletic departments to make the program meaningful for the athletes given that most programs face significant budgetary and facility challenges and the fact the athletes have limited time in competition and practice while they are in the program.

Colorado High School Football Participation – Before and After 2010

Has Colorado high school football suffered because of the concussion crisis in college and professional football?

For years the National Football League denied that head trauma could have long-term consequences on its athletes. Finally in 2010, the NFL publicly admitted that many of its former players were suffering from chronic traumatic encephalopathy (CTE). In 2014, Boston University release a study showing that almost all of the brains studied tested positive for CTE.

Over the past decade the increased awareness of brain trauma and concussions has resulted in the establishment of protocol to identify when athletes have received a concussion. These protocols apply to all sports and all levels of play. As well they would apply to situations off the courts and playing fields.

In some places, reports have indicated that participation in football has resulted in a reduction in the number of football players.

Colorado High School Football

Data from the NFHS shows that the concussion crisis had no impact on the number of Colorado schools with football teams. This data is for the 13 academic years beginning in 2002/2003 and ending 2014/2015. There were 215 teams in 2002/2003 and 211 teams in 2014/2015. This data does not include 8-man football teams. (The program data for 2006/2007 and 2007/2008 appears to be an aberration).

Colorado High School Football

Most years, the average number of participants per program was about 70.

Colorado High School Football

The number of participations reached almost 18,000 in 2007/2008, but declined sharply the next two year. In has since been in the 15,000 to 16,000 range. The fear of concussion on the number of participants appears to be temporary and minimal at this point.

The NFHS data also reported that there were about 50 girls who play high school boys football each year. On average, this means there is about one girl for every four programs.

In 2013/2015, 216 girls participated in the boys programs. The following year, that number dropped back to 35.

Despite the concussion crisis,  Colorado high school football continues to be the king of adolescent sports. Its popularity will likely increase with the recent Super Bowl win by the Denver Broncos.

Colorado Girls High School Tennis Has Strong Foundation

Between the 1999/2000 and 2014/2015 academic years the number of Colorado girls high school tennis programs in Colorado ranged from 110 to 153, with the peak coming in 2014/2015. This increase comes after declines in the two previous seasons. The range of the number of boys and girls programs was similar during these 15 years.

colorado girls high school tennis

For this period, there has been a wide range of participation in girls programs. Interestingly, there is a solid correlation between the number of girls programs and the number of participants. That was not the case with the boys tennis. Over this period the annualized rate of growth in participation is 2.4%.

At its peak in 2008/2009, there were 4,901 participants. The number of participants has since trended downwards, for no obvious reason.

The lowest number of participants during this period occurred in 1999/2000.

colorado girls high school tennis

Between 1999 and 2015 the Colorado population increased by from 4.2 million to 5.4 million. This is a gain of 1.2 million people, at an annualized rate of 1.7%.

The number of females between the ages of 15 and 19 increased from 144,081 in 1999 to 176,661 in 2015. This is a gain of 32,580, at an annualized rate of 1.4%. It appears that girls tennis is growing at a much higher rate than the population of females in the 15-19 year range.

Over the past three years the average number of players per program has been about 30 students.

colorado girls high school tennis

There are a number of factors that are a challenge to girls high school tennis in Colorado such as the lack of quality coaches and adequate funding and facilities. Nationally, tennis is growing at an annualized rate less than the rate of growth in the U.S. population, (less than 1.0%). Probably the biggest challenge is that girls tennis in Colorado is a spring sport and the weather in the spring is often windy, cold, and wet.

On the other hand, many girls participate in programs because the season is short, most players are recreation level players, and many programs emphasize the social aspect of the sport.

Colorado girls tennis has a strong foundation and should continue to grow.

Source: NFHS.

Colorado Boys High School Tennis On Solid Footing

Between the 1999/2000 and 2014/2015 academic years the number of Colorado boys high school tennis programs ranged from 110 to 144, with the peak coming in 2007/2008. Since that time, there has been a decline in the number of programs. The range of the number of boys and girls programs was similar during these 15 years.

colorado boys high school tennis

For this period, there has been a wide range of participation in boys programs. Interestingly, the number of participants has a low level of correlations with the number of programs. At its peak, there were 3,707 participants, although that number appears to be an aberration. With the exception of this value, the number of participants ranged from 2,059 to 3,061. The number of participants has trended downward since 2010/2011. Over this period the annualized rate of growth in participation is 2.2%.

colorado boys high school tennis

Between 1999 and 2015 the Colorado population increased from 4.2 million to 5.4 million. This is a gain 1.2 million people, at an annualized rate of 1.7%.

The number of males between the ages of 15 and 19 increased from 156,330 to 185,377. This is a gain of 29,047 males, at an annualized rate of 1.1%.

On average there were 23 participants per team over the past three years.

colorado boys high school tennis programs

There are a number of factors that are responsible for Colorado boys high school tennis not growing at a faster rate, including inadequate funding, facilities, and the lack of quality coaches. As well, U.S. tennis is growing at a long-term annualized rate less than the rate of growth in the U.S. population, (less than 1.0%). Probably the most important reason why the sport is not showing stronger growth is stiff competition from other fall sports. Football is the dominant fall sport, but cross country, soccer, golf and lacrosse are popular sports.

Overall, Colorado boys high school tennis is on solid footing, despite recent challenges.

Source: NFHS.

Percentage of Points Won – Stanford, Nebraska, and CU Volleyball

What is the difference in the percentage of points won for winners and losers?

The top teams in the country win slightly more than half the points they play in conference matches. At the other end of the pecking order the worst teams in the country win 40% to 45% of the points they play.

As expected, teams that win about half the points will win about half the sets and about half their matches.

To illustrate this point, consider the 2006 and 2014 University of Colorado teams.

During the 2006 conference season the Lady Buffs won:
• 49.5% of the points
• 53.1% of the sets
• 60.0% of the matches.
During the 2014 season the Lady Buffs won:
• 50.0% of the points
• 50.0% of the sets
• 55.0% of the matches.
Both seasons the Lady Buffs were invited to the NCAA Championships and won their first round matches before bowing out.

When teams win less than half the points they win a much smaller percentage of the sets and an even smaller percentage of the matches. A prime example was the 2009 CU Lady Buffs.

During the 2009 season the Lady Buffs won:
• 42.8% of the points
• 16.7% of the sets
• 10.0% of the matches.
They had one of the poorest records in the country for Division I teams.

When teams win more than half the points those wins are magnified. A greater percentage of sets are won and an even greater percentage of matches are won.

During the 2014 season the Nebraska Cornhuskers won:
• 52.1% of the points
• 66.2% of the sets
• 70.0% of the matches.
The Cornhuskers lost 3-0 to finalist BYU in the quarterfinals of the NCAA Championships.

The 2014 Stanford Cardinal team won:
• 54.3% of the points
• 78.4% of the sets
• 95.0% of the matches.
The Cardinal lost to champion Penn State in the semifinals.

The 2006 Nebraska Cornhuskers won:
• 56.4% of the points
• 89.4% of the sets
• 95.0% of the matches.
The Cornhuskers were National Champions in 2006. Their only loss was to the Lady Buffs, a team that won less than half its points in conference play. Despite their one loss, this Husker team was incredibly dominant.

The data shows there is a fine line between the percentage of points won for the best and the worst teams in the country. For additional information, see the report Team Tendencies and the Importance of Winning a Point.

Percentage of Points Won - Stanford, Nebraska, CU

CU Buffs Football Team – Attendance Slips Further

The primary goal of Division I football teams is to win and make money; however, the hard cold facts are that half the teams that play every Saturday are losers.

Over the past decade the abysmal win-loss record of the CU Buffs football team has given fans a reason to find other things to do on Saturday afternoons than support the black and gold.

The problems began a decade ago.

The Buffs finished the 2004 and 2005 seasons with 7-5 records. That is outstanding by today’s standards.

In 2004 they were 4-4 in the Big 12 and in 2005 they were 5-3. Oklahoma beat them 42-3 in the 2004 Big 12 Championships and Texas thumped them 70-3 the following year.

Many viewed these drubbings in the championships as a sign that CU was not capable of participating in the D1 football race to see which program could spend the most money.

The CU administration viewed the losses differently. They used them as justification for hiring a new coach.

In retrospect, those days of getting slaughtered in the  Big 12 championships were the good old days. The Buffs football team has not had a winning season since 2005.

In 2011, dollar signs flashed in front of the CU administrators and CU jumped from the Big 12 to the PAC-12 conference. Unfortunately the Buffs found out the PAC-12 also had teams that knew how to play football.

Since 2011, the Buffs have had four conference wins – two on the road and two at home. Details follow:

Year Conference Record Comments
2011 2-7 conference record Home win over Arizona and a road win against Utah.
2012 1-8 conference record Road win over Washington State.
2013 1-8 conference record Home win over California.
2014 0-9 conference record Ugh!

Unfortunately, the Buffs conference home attendance has paralleled the number of wins on the field.

2011
The Buffs were 1-4 at home in conference play.
• 9/10 49,532 California
• 10/1 51,928 Washington State
• 10/22 52,123 Oregon
• 11/4 50,083 Southern California
• 11/22 48,111 Arizona.
Average conference home attendance 50,355.

2012
The Buffs were 0-5 at home in conference play.
• 9/29 46,893 UCLA
• 10/11 45,161 Arizona State
• 10/27 44,138 Stanford
• 11/17 43,148 Washington
• 11/23 46,052 Utah.
Average conference home attendance 45,078.

2013
The Buffs were 1-3 at home in conference play.
• 10/5 45,944 Oregon
• 10/26 38,679 Arizona
• 11/16 38,252 California
• 11/23 36,005 Southern California.
Average conference home attendance 39,720.

2014
The Buffs were 0-5 at home in conference play.
• 9/13 38,547 Arizona State
• 10/04 36,415 Oregon State
• 10/24 37,442 UCLA
• 11/1 35,633 Washington
• 11/29 39,155 Utah
Fewer than 40,000 people attended every home game and average conference home attendance was 37,438.

Given these numbers, it’s a tough time to be the football coach or athletic director at the University of Colorado. Buff fans can only hope for a turn-around in 2015.

Colorado Volleyball is the Winner in NCAA Tournament

Colorado volleyball will be the winner on December 5th and 6th as the University of Northern Colorado squares off against the University of Colorado and the University of Denver faces Colorado State University in the first round of play of the 2014 NCAA Division I volleyball championships.

The first round play will be special because twenty of the fifty-eight rostered players on the four teams played high school volleyball in Colorado.

The leader is DU. Seven of the fourteen players are from the Centennial State.

  • Nola Basey, Outside Hitter, 6-2, Sophomore, Lyons
  • Erica Denney, Middle Hitter, 6-5, Red-shirt Senior, Aurora
  • Monique Domme, Setter, 5-11, Sophomore, Colorado Springs
  • Bailey Karst, Setter, 5-10, Senior, Aurora
  • Taylor Loyd, Defensive Specialist/Libero, 5-7, Freshman, Centennial
  • Ruth Okoye, Middle Blocker, 6-1, Sophomore, Aurora
  • Sarah Schmid, Middle Blocker, 6-1, Junior, Highlands Ranch

Five of the fifteen Buffs are Coloradans.

  • Kelsey English, Middle Blocker, 6-2, Senior, Colorado Springs
  • Nicole Edelman, Setter, 6-0, Junior, Boulder

    Colorado volleyball - Nicole Edleman and Cierra Simpson
    Setter Nicole Edelman and Cierra Simpson (10) are two of the five in-state Buff players.
  • Cierra Simpson, Defensive Specialist/Libero, 6-0, Sophomore, Colorado Springs
  • Gabby Simpson, Setter ,6-3, Freshman, Colorado Springs
  • Simpson, Outside Hitter, 6-3, Senior, Colorado Springs

Four of the fourteen Rams are from Colorado.

  • Jaime Colaizzi, 5-4, Libero, Junior, Windsor
  • Grace Gordon, 5-7, Defensive Specialist/Setter, Junior, Denver
  • Kelsey Snider, 6-1, Middle Blocker, Red-shirt Senior, Westminster
  • Kaitlind Bestgen, 5-10, Defensive Specialist, Red-shirt Junior, Fort Collins

Four of the fifteen women from UNC call Colorado home.

  • Kim Weissmann, 6-0, Outside Hitter, Freshman, Loveland
  • Meagan Garcia, Defensive Specialist, Junior, 5-4, Platteville
  • Ryleigh Haynes, Setter, Freshman, 5-11, Eaton
  • Kendra Cunningham, OH, Junior, 5-9, Eaton

CU and CSU are favored to win the first round matches and the Rams are likely to come out on top against CU.

No matter the outcome of the matches, Colorado volleyball is the winner!


The Colorado Paradox – The State High in Fitness and Drug Use

In March, 2013 Gallup pollsters released research showing that Colorado has the nation’s lowest obesity rate; 18.7% of adults are obese. This percentage on the Gallup-Healthways Well-Being Index was the only state to register below 20%. The second place state, Massachusetts, was almost 22%.

But the good news ends there.

The 2012 Statistical Abstract (table 204) reports that Colorado is also one of the most highly ranked states for use of select drugs (A ranking of 1 is worst and 51 is best – Washington, D.C. included) :

  • 25th cigarette smoking – 1,007,000 people, or 25.1% of the Colorado population, ages 12+.
  • 9th for binge drinking – 1,072,000 people, or 26.7% of the Colorado population, ages 12+.
  • 5th for any illicit drug use – 470,000 people, or 11.7% of the Colorado population, ages 12+.
  • 4th for marijuana use – 370,000 people, or 9.2% of the Colorado population, ages 12+.
  • 4th for any illicit drug use, other than marijuana – 183,000 people, or 4.6% of the Colorado population, ages 12+.

In each of these five categories, the percentage of Coloradans partaking in these vices is greater than the U.S. percentage.  Colorado’s Rocky Mountain high is truly a unique paradox.

This data is for the period 2007 to 2008, i.e. it is prior to the passage of Amendment 64.


Do Athletic Programs Lift the Boats of All Programs at Top Universities? – NIH Funding

College presidents, athletic directors, and other higher education leaders have been quick to defend their athletic programs in the light of recruiting scandals, seven-figure salaries for coaches, the Penn State atrocity, player abuse by coaches, and unsustainable budget and facility increases. Their claims focus on the value athletic programs bring to the university, how sports are the heart and soul of universities, how athletic departments lift all boats, increase the fundraising abilities, and make the universities world class institutions. Athletic programs are an integral part of the athletic experience, but their value to higher education is often overstated.

For the sake of discussion, consider the question, “What do the football teams look like at the schools that top the list for National Institute of Health (NIH) funding?”

In 2010 about $21.2 billion of NIH funding was distributed to universities. Two-thirds of that funding, about $14 billion) was distributed in 10 states (CA, MA, NY, PA, TX, MD, NC, WA, IL, OH). Colorado was ranked 19th at $283 million, or 1.33% of total funding.

The top 100 universities received $19.5 billion, or 92% of total NIH funding in 2010. The top 10 schools received 24.5% of the NIH funding, or $5.2 billion. They are listed below, along with their NCAA level of competition:

  1. Johns Hopkins University, $686.5 million, Division 3.
  2. University of Pennsylvania $577.0 million, Division 3.
  3. University of Washington $570.7 million, Division 1.
  4. University of Michigan, $565.1 million, Division 1.
  5. University of California at San Francisco, $537.7 million, no athletic program.
  6. University of Pittsburgh, $493.0 million, Division 1.
  7. Washington University, $449.5 million, Division 3.
  8. Yale University, $442.4 million, Division 3.
  9. University of California at San Diego $441.0 million, no football program.
  10. Duke University, $438.9, Division 1 football.

Four schools were from Division 1, four schools played in Division 3, UCSD did not have a football team, and the UCSF did not have an athletic program. In other words, academics take precedence at a majority of the top 10 schools on the list of NIH funding.

The 2010 athletic budgets for the schools in major athletics conferences follow:

  • University of Washington, $60.6 million projected revenue.
  • University of Michigan, $94.4 million projected revenue.
  • University of Pittsburgh, not available.
  • Duke University, $68.8 million projected revenue.

The funding from NIH is 6-9 times greater than the athletic budgets for these schools.

Pac 12 fans will be pleased to see that the current PAC-12 schools were well represented in the top 100 schools for NIH funding.

  • 3.   University of Washington $570.7 million, 2.7%.
  • 11. UCLA, $436.6 million 2.1%.
  • 12. Stanford University, $413.5 million 1.9%.
  • 24. USC, 242.2 million 1.1%.
  • 44. University of Utah, $166.5 million, 0.8%.
  • 55. University of California Berkeley $137.3 million, 0.6%.
  • 66. University of Arizona, $109.2 million, 0.5%.
  • 94. University of Colorado at Boulder $67.0 million 0.3% – does not include UCD.

These eight PAC-12 schools received 10.1% of total NIH funding for 2010.

The 2010 athletic budgets for these schools follow:

  • University of Washington, $63.2 million.
  • UCLA, $61.9 million.
  • Stanford, not available
  • USC, not available
  • University of Utah, $27.8 million.
  • University of California Berkeley, $69.4 million
  • University of Arizona, $45.0 million.
  • University of Colorado at Boulder, $46.6 million.

The data makes the case that both academics and athletics make different, but significant fiscal contribution to universities. College leaders are only kidding themselves when they overstate the value of athletic programs.


Colorado Obesity Rate Increases – Again

Obesity is a serious issue – both from a cost and health perspective – and it can be addressed, in part, by diet and exercise.

Lately the topic has received a lot of air time, particularly in regards to the obesity rate of Coloradans. On March 22, The Denver Business Journal reported, “Health Report Card: Colorado’s Still the Leanest State, but More of us are Obese.”

It is the final six words of that sentence that are the most important.  Thank goodness, the media is looking past the meaningless rankings. They are finally emphasizing the important part of the story.
The article indicated that 22% of Colorado’s population is obese, according to the 2011 Colorado Health Report Card recently released by the Colorado Health Foundation (CHF). In 1995 that level of obesity would have ranked Colorado as the most obese state in the U.S.
Kind of scary how all those French fries pack on the pounds over time. Rather frightening to think about how obesity rates have rising in other states.

The state health care report card includes more than just a discussion of obesity. Additional information can be found by viewing the report card or visiting the CHF website.