PAC-12, Smack 12 – Best Volleyball Conference?

PAC-12, Smack 12 – for a number of years, smack talkers from the West have claimed the PAC-12 is the top collegiate volleyball conference in the country. At times that has been true; however, that wasn’t the case in 2015.

Without a doubt the Big 10 was the country’s elite collegiate volleyball conference this season. The following table shows the win-loss records for the NCAA teams from the Big 10.

Team Record
Nebraska 6-0
Minnesota 4-1
Illinois 2-1
Ohio State 2-1
Penn State 2-1
Wisconsin 2-1
Michigan State 1-1
Michigan State 1-1
Purdue 1-1

Not only did the tournament champion come from the Big 10, but six of the conference teams had winning records and all of the Big 10 teams won matches.

The Huskers won six matches – three were 3-0 and three were 3-1. Their dominance was impressive given the depth of the field.

Looking ahead to next season, you have to feel sorry for the Big 10. The leading hitter for Nebraska was Kadie Rolfzen (412 kills) and right behind her was Mikaela Roecke (386 attacks). Rolfzen is a junior and Roecke is a freshman.

Amber Rolfzen led the team in blocks (182) and Kelly Hunter led the team in assists (1,501). Rolfzen is a junior and Hunter is a sophomore. The chances are pretty good that Nebraska will have a “decent” team in 2016.

Sixty four teams played in the NCAA championships. These teams represented thirty-two conferences.

The following 20 teams and conferences were at the bottom with 0-1 records.

University Conference
• SMU American Athletic Conference
• New Hampshire American East Conference
• Lipscomb Atlantic Sun Conference
• NAU Big Sky
• Coastal Carolina Big South Conference
• UNC Wilmington Colonial Conference
• Cleveland State Horizon League
• Fairfield Metro Atlantic
• Ohio Mid-American Conference
• Howard Mid-Eastern Athletic Conference
• Colorado State Mountain West
• Robert Morris Northeast Conference
• Belmont Ohio Valley Conference
• Furman Southern Conference
• Texas A&M Corpus Christi Southland Conference
• Jackson State Southwestern Athletic Conference
• Arkansas State Sun Belt
• Harvard The Ivy League
• Denver The Summit League
• NMSU WAC

In addition, the PAC-12 and Missouri Valley Conference were leaders for the number of teams with first round losses. Both had three, followed by the Big 12 with two. The ACC, SEC, WCC, and Big East also had teams that bowed out in the first round.

Only 12 conferences had teams that won matches and only six conferences had winning records.

Conference Record
Big 10 21-8
Big 12 10-5
PAC-12 9-7
SEC 5-4
WCC 5-4
Big West 3-1
Big East 3-3
ACC 3-4
Atlantic 10 Conference 1-1
Conference USA 1-1
Patriot League 1-1
MVC 1-4

Only 16 of the 64 teams had winning records

University Conference Record
Nebraska Big 10 6-0
Texas Big 12 5-1
Minnesota Big 10 4-1
Kansas Big 12 4-1
Hawaii Big West 3-1
USC PAC-12 3-1
Washington PAC-12 3-1
Florida SEC 3-1
Illinois Big 10 2-1
Ohio State Big 10 2-1
Penn State Big 10 2-1
Wisconsin Big 10 2-1
Creighton Big East 2-1
UCLA PAC-12 2-1
BYU WCC 2-1
Loyola Marymount WCC 2-1

While it is entertaining to play with the data and talk smack about which conference is best, the most impressive aspect of the 2015 NCAA Championships was the number of quality players on all teams.

Congrats to the Cornhuskers and Big 10 on a great season!

Two Points a Set – CU’s Long and Winding Road to Improvement

Since 2007, the University of Colorado Women’s Volleyball program has been challenged to put a team on the court that wins in conference play. This post presents data that documents the improvement made by the Lady Buffs from 2009 to 2014.

Background

In 2006 the Lady Buffs won 49.5% of the points in conference competition, they qualified for the NCAA Championships, and were ousted in the second round. Data for 2006 and 2007 are not included in this discussion because sets were played to 30 points at that time.

In 2007 CU only won a single conference match with virtually the same team that had won the first round in the 2006 NCAA Championships.

In 2008, the rules were changed and sets were played to 25 points. The fortunes of the Lady Buffs improved slightly – they won seven matches.

In 2009 changes were made in the CU program and Liz Kritza took over as coach. Her teams won six out of 62 matches in her first three seasons.

The Buffs switched to the PAC-12 Conference in 2011.

In the inaugural PAC-12 season there were 22 conference matches. For purposes of discussion in this post, the data for 2011 has been adjusted to make it comparable to other years. Twenty matches were played in 2012 and subsequent years.

In 2012 the Lady Buffs won four of twenty matches. They were victors half the time when their 2013 and 2014 totals are combined.

Results

The 2009 conference season was abysmal. The Lady Buffs were not competitive – they won their fewest number of points (1,205) and lost their least number of points (1,609).

To become a competitive team it was necessary for the Lady Buffs to win more points. At the same time they needed to lose fewer points.

As can be seen by fast forwarding to 2014, the Lady Buffs have made progress. IT IS IMPORTANT TO NOTE HOW SLOW THAT PROGRESS HAS BEEN.

They won half the points played in 2014, were 11-9 in conference play, qualified for the NCAA Championships, and won their first round match. For the sake of comparison, the 2014 points won/lost for CU, Stanford, and Nebraska follow:
• CU 1,651 points won and 1,648 points lost.
• Stanford 1,774 points won and 1,493 points lost. Stanford lost in the NCAA semis to champion Penn State.
• Nebraska 1,633 points won and 1,500 points lost. Nebraska lost in the NCAA quarters to finalist BYU.

As can be seen, the Lady Buffs are half-way to becoming an elite team. They are now winning about 1,600 points per season. Unfortunately, they have consistently lost at least 1,600 points per season since 2008. That total will have to be reduced to about 1,500 for CU to move to the next level.

Year Points Won Points Lost % Points Won Record
2008 1,512 1,707 47.0% 7-13
2009 1,205 1,609 42.8% 2-18
2010 1,302 1,639 44.3% 3-17
2011 adjusted 1,304 1,629 44.5% 1-21
2012 1,354 1,655 45.0% 4-16
2013 1,516 1,635 48.1% 9-11
2014 1,651 1,648 50.0% 11-9

Points Won by Year

In 2008 the Lady Buffs won 1,512 points. Point production dropped to 1,205 when the team cratered in 2009. It didn’t return to the 2008 level until 2013 when the team reached 1,516 points.

Year Points Won Difference Prior Year Avg. Diff. Points/Match Avg. Diff. Points/Set
2008 1,512
2009 1,205 -307 -15.4 -4.7
2010 1,302 97 4.9 1.3
2012 1,354 50 2.5 0.7
2013 1,516 162 8.1 2.2
2014 1,651 135 6.8 1.7

There was little change in the points won between 2010 and 2012. On average the Lady Buffs found a way to win 7-8 additional points each match or about 2 additional points per set throughout both the 2013 and 2014 seasons.

TWO POINTS A SET! That sounds so easy.

The data shows there is a fine line between the number of points won for a 4-16 team, a 9-11 team, and a team with an 11-9 record. For additional information, see the report Team Tendencies and the Importance of Winning a Point.

Two Points a Set

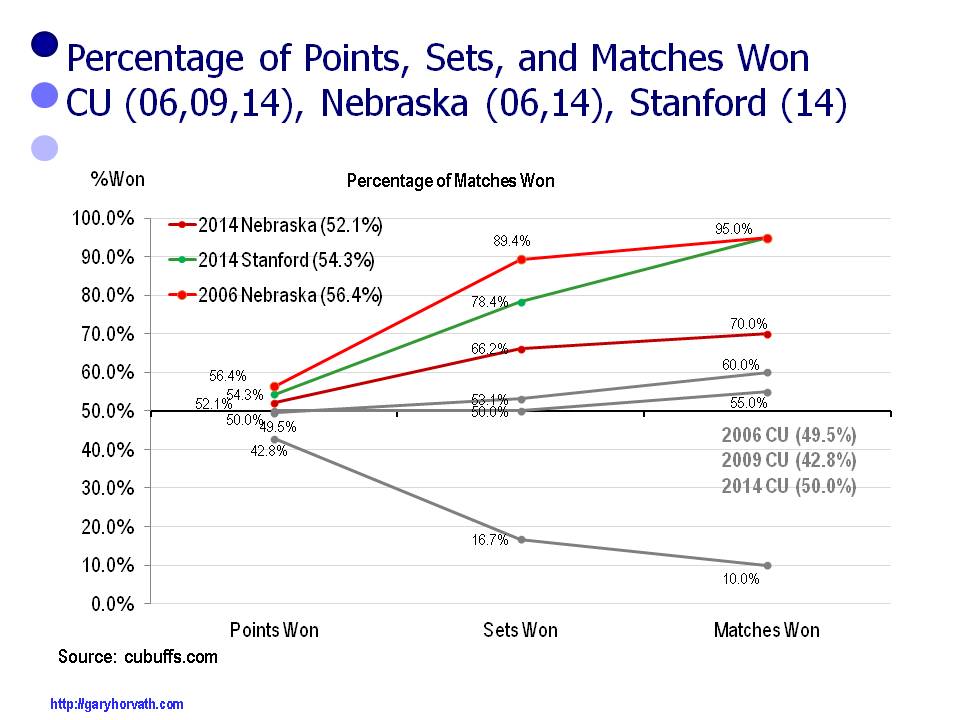
Percentage of Points Won – Stanford, Nebraska, and CU Volleyball

What is the difference in the percentage of points won for winners and losers?

The top teams in the country win slightly more than half the points they play in conference matches. At the other end of the pecking order the worst teams in the country win 40% to 45% of the points they play.

As expected, teams that win about half the points will win about half the sets and about half their matches.

To illustrate this point, consider the 2006 and 2014 University of Colorado teams.

During the 2006 conference season the Lady Buffs won:
• 49.5% of the points
• 53.1% of the sets
• 60.0% of the matches.
During the 2014 season the Lady Buffs won:
• 50.0% of the points
• 50.0% of the sets
• 55.0% of the matches.
Both seasons the Lady Buffs were invited to the NCAA Championships and won their first round matches before bowing out.

When teams win less than half the points they win a much smaller percentage of the sets and an even smaller percentage of the matches. A prime example was the 2009 CU Lady Buffs.

During the 2009 season the Lady Buffs won:
• 42.8% of the points
• 16.7% of the sets
• 10.0% of the matches.
They had one of the poorest records in the country for Division I teams.

When teams win more than half the points those wins are magnified. A greater percentage of sets are won and an even greater percentage of matches are won.

During the 2014 season the Nebraska Cornhuskers won:
• 52.1% of the points
• 66.2% of the sets
• 70.0% of the matches.
The Cornhuskers lost 3-0 to finalist BYU in the quarterfinals of the NCAA Championships.

The 2014 Stanford Cardinal team won:
• 54.3% of the points
• 78.4% of the sets
• 95.0% of the matches.
The Cardinal lost to champion Penn State in the semifinals.

The 2006 Nebraska Cornhuskers won:
• 56.4% of the points
• 89.4% of the sets
• 95.0% of the matches.
The Cornhuskers were National Champions in 2006. Their only loss was to the Lady Buffs, a team that won less than half its points in conference play. Despite their one loss, this Husker team was incredibly dominant.

The data shows there is a fine line between the percentage of points won for the best and the worst teams in the country. For additional information, see the report Team Tendencies and the Importance of Winning a Point.

Percentage of Points Won - Stanford, Nebraska, CU

Women’s Volleyball Team Tendencies

The women’s volleyball scores for the University of Colorado were evaluated for the nine-year period 2006 to 2014. In addition, scores were included for select Nebraska and Stanford seasons. From this analysis points won, sets won, and matches won, the following team tendencies were developed.

The following definitions are used in the description of the different levels.
Blowouts – decided by 10 points or more.
Solid – decided by 5 to 9 points.
Competitive – decided by 3 or 4 points.
Close – decided by 2 points.

Tier I Teams
• Win more than 53% of the points.
• Don’t lose blowout sets and less than 10% of sets are solid losses. They don’t give opponents a chance to get into the match.
• Win a majority of the close and competitive sets.
• At least 35% of the sets are solid wins
• At least 10% of the sets are blowout wins.
• Win at least 80% of their matches and most wins are 3-0.

Tier II Teams
• Win between 50.1% and 53.0% of the points.
• May lose a few blowout and solid loss sets.
• Win a majority of close and competitive matches.
• About 30% of their sets are solid wins and 5% are blowouts.
• Win at least 66% of their matches and most wins are 3-0 or 3-1.

Tier III Teams
• Win 48.1% to 50% of the points.
• Less than 10% of sets lost are blowouts and 20% solid losses.
• Sometimes win a majority of the close and competitive matches.
• Win about 20% of the sets are solid wins
• May win a few blowout sets.
• Win about half their matches.

Tier IV Teams
• Win between 45.1% and 48% of the points.
• About 20% of their sets are blowouts and 25% are solid loses.
• Most losses are 3-0 or 3-1.
• Win about 35% of their sets and matches.

Tier V Teams
• Win less than 45.1% of their points.
• More than half their sets are solid losses or blowouts.
• A majority of their matches are lost 3-0.
• Win less than 30% of their matches.

The above hierarchy will allow coaches to identify where their team falls in the peaking order and provide them with coaching that will help them move up the pecking order.

For additional information, click here and go to the report Team Tendencies and the Importance of Winning a Point.